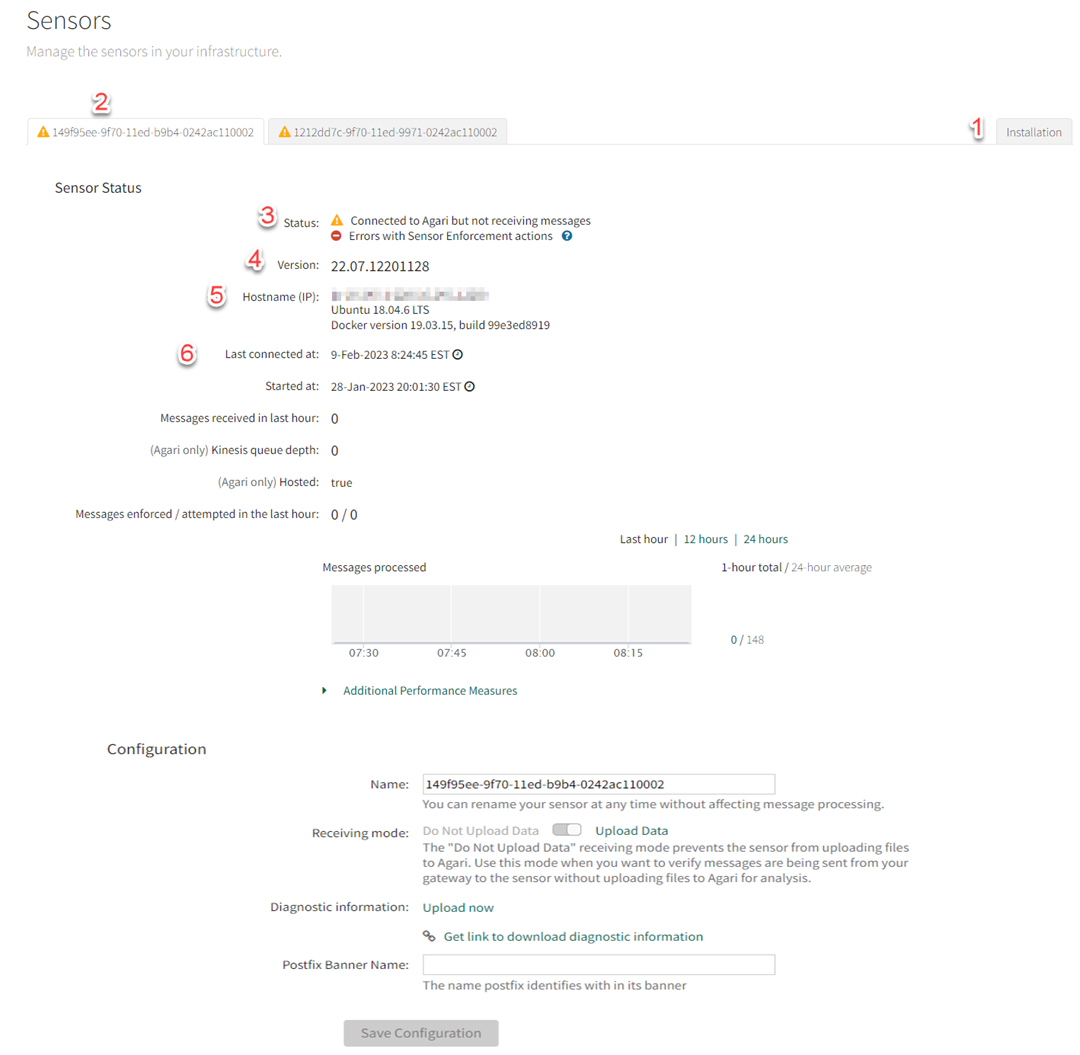
View Sensor Status
View the status of your Sensors and manage them via the Manage > Sensors page.
NOTE: If Graph API Enforcement is enabled in your organization, Enforcement Sensor Status is redundant and not visible on the Sensor page.

| 1 | You can download a Sensor installation script or a virtual machine package keyed specifically to your organization from the Sensors page. Use this to install additional Sensors to handle increased traffic. See Install a Sensor Via Script and Install a Sensor Via OVA for more information. |
| 2 | If you have multiple Sensors, select a Sensor from the list of tabs. You can view the current status of the Sensor and make configuration changes from this page. The overall status of a Sensor is indicated by the icon (green/yellow/red) on the tab. |
| 3 | If you have enforcement enabled, you can see separate status icons for Send/Receive and Enforcement inside the tab. The Enforcement icon is green when more than 80% of messages that should be enforced, are enforced. It's yellow when below that threshold. See the Why are some messages not moved? link on the Policy Report page for any policy with the Enforcement action (click the Number of Matching Messages bar to the right of the policy name on the Manage > Reports page). |
| 4 | Update the Sensor. Select from the list of available versions and click Update. |
| 5 | Hostname and IP address of the virtual machine on which the Sensor is deployed. |
| 6 | Last Connected is the time the Sensor last checked in with Fortra Cloud Email Protection. This should be within the last two minutes (if the Sensor is active). |
NOTE: For Office 365 customers only, there may be a "Download Credentials File" button, for credentials used by the Sensor to perform enforcement activities.
Click Save Configuration to save any changes you have made for the Sensor. The changes are propagated to the Sensor and can take up to 5 minutes to take effect.