Task Durations Chart |
Overview
The Task Durations chart displays previous task execution durations measured in seconds. Results include minimum, maximum and average execution times which are color coded for easy recognition. Horizontal bars represent the duration values for a task. Bar lengths are proportional to the values that they represent (as shown below).
For complete instructions on how to use charts, see Using Charts.
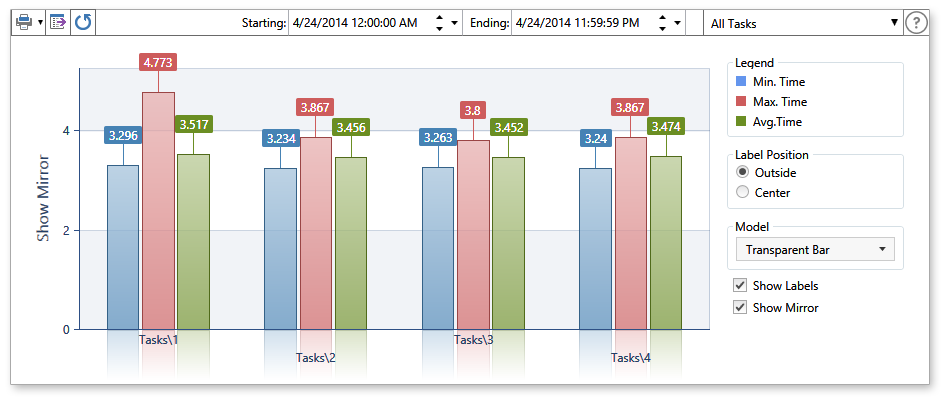
Chart Elements
|
Name |
Description |
|
Legend |
Identifies what the various elements in the chart represent indicated by colors. The available options are:
|
|
Label Position |
The position of the label that indicates the value of each data point. The available options are:
|
|
Model |
The list of chart element styles to select from, including outset, gradient, transparent and 3d bar styles, just to name a few. Click the down arrow and select from the drop-down list of styles that appear. |
|
Show Labels |
If enabled, specifies that labels will be shown (either above or in the middle of each bar element, depending on which option was selected under Label Position (enabled by default). |
|
Show Mirror |
If enabled, the chart displays a portion of each bar element inverted and transparent to visually display a "mirrored" effect (disabled by default). |