Audit Events Table |
Overview
The Audit Events report provides a table view of all Automate Enterprise audit-related events. It tracks the user who performed each event as well as the event date, type and status. You can sort, filter, and analyze this data to determine who has done what with regards to agents, workflows and individual workflow objects. For example, you can determine who created a specific workflow or renamed a certain task. The Audit Events report also tracks security related events such as permission changes on automation objects and user login/session information (i.e. session timeout, failed attempts to open a session, user lock out, etc.). Some common events available for audit log reports include:
- Creation - Reports which workflows or workflow objects have been created, which agents have been registered/deployed.
- Deletion - Reports which workflows, workflow objects, agents or users have been deleted.
- Connection - Reports which agents established connection with the server and which users/groups logged onto Server Management Console.
- Object modification - Reports changes to objects, such as deletion of a workflow, renaming an event or condition, modification of task steps, and disabling/re-enabling objects.
- Security settings - Reports user/group events and changes to security settings, such as modifications to user accounts and permissions. Also tracks addition or removal of licenses.
- Import/Export - Reports all import and export operations. Also tracks objects that have been moved and copied to other locations in the repository.
The Audit Events report is ideal from a project management standpoint because it helps administrators easily track the condition and progress of team projects or individual assignments by monitoring all aspects of task and workflow creation, development and modification. This can aid team members as well by allowing everyone on the team to view what projects others on the team are responsible for as well as the status of those projects. This report supports exporting to multiple document types, column filtering, data grouping, sorting, filtering and more.
For complete instructions on how to use table reports, see Using Table Reports.
Data Sources
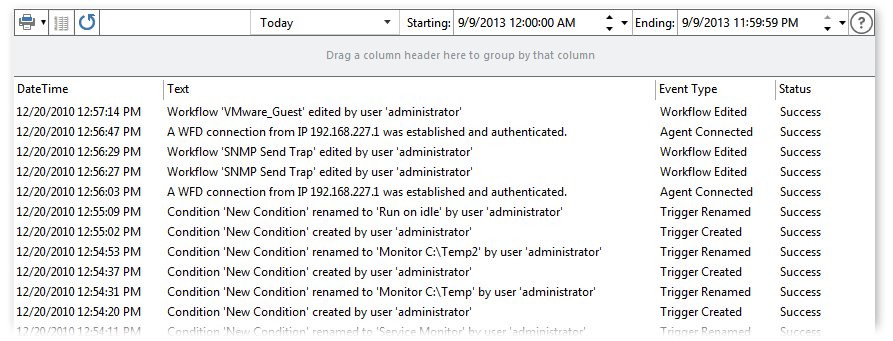
The Audit Events report displays data in a two-dimensional table. The bound data is arranged in columns and rows. Grid columns correspond to data fields in a data source, rows represent data records. The table below lists the available data sources along with a description.
| Column | Description |
|---|---|
| Event ID | The unique identifier for the audited event. All audit events include the event ID they originated from, to make report generation easier. |
| Construct ID | The unique identifier for the object. All audit events performed on an object includes a construct ID for that specific object. |
| DateTime | The date and time when the audit event occurred. |
| Text | A detailed text description of the audit event. |
| Event Type | The type of audit event (i.e. Workflow Edited, Trigger Created, Agent Connected, etc.). |
| Status | The status of the event; whether it was a success or failure. |
| User | The user that performed the audit event. |
| Data | A placeholder for any metadata collected regarding the audit event. This field may or may not become populated depending on the event that took place. Each piece of data is delimited by a pipe (|) character. |
Report Filtering
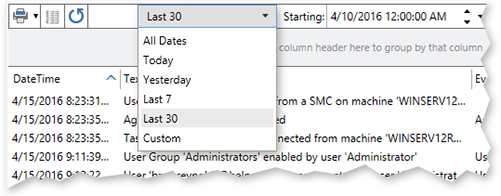
Filter by Predefined Date Range
Click the pre-defined date range box located on the Filter bar (as shown below), and then select the desired range.
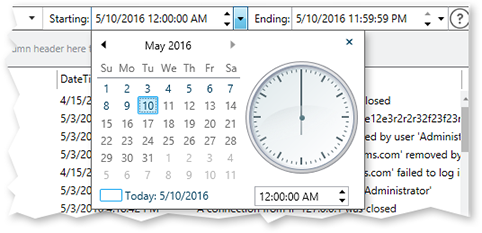
Filter by Custom Date Range
- Edit the Starting field by manually editing the date and time, or click the box to display a calendar.
- Edit the Ending field by manually editing the date and time, or click the box to display a calender.
Filter Columns
The Columns button allows you to filter the columns to be included in the report. To filter by columns, click the Columns icon, and then select/deselect the desired columns (deselected columns do not have a check mark).

Filter Column Data
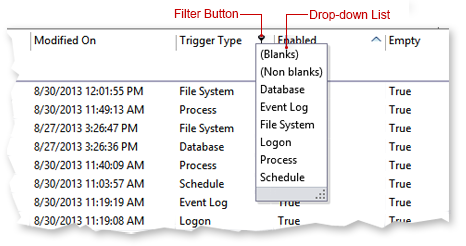
To filter the data in a column: over your mouse over the column until a filter icon appears, and tThe Filter button allows you to filter the data that appears for a certain column.
-
Hover your mouse cursor over a column header, and then click the Filter icon that appears.
-
Select the column data to include in the report from the drop-down list.
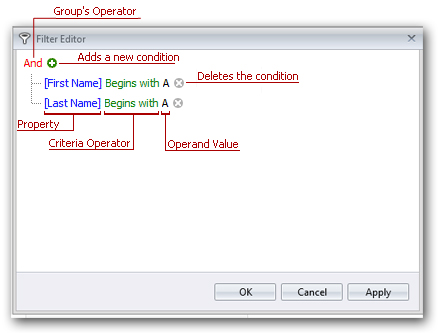
Advanced Filtering
The Filter Editor allows users to build complex filter criteria with an unlimited number of filter conditions combined by logical operators. To open the Filter Editor, right-click any column header, and then select Filter Editor. The Filter Editor displays filter criteria as a tree structure, where nodes represent simple filter conditions. If the filter criteria consist of multiple filter conditions, the Filter Editor contains multiple nodes linked by logical operators.