Debug Panel - Call Stack |
A stack is a dynamic data structure that stores information about the active sub-tasks contained in a task. The Call Stack debug window changes dynamically when sub-tasks are used. It displays execution depth of the current task and allows you to keep track of the point at which each active sub-task should return control to the main task when it finishes executing.
Parameters
The Call Stack debug window generates information into a single column:
|
Column Header |
Description |
|
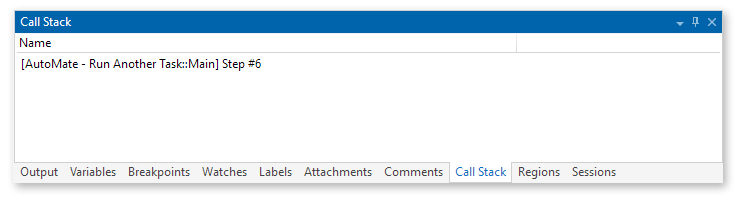
Name |
The name of the current task and task function are enclosed inside [] brackets followed by the current step number (i.e., NOTE: If no task function is selected, the default task function named "Main" will be displayed. |
Context Menu
Right-clicking inside the Output panel opens a context menu that contains the following items.
|
Menu Item |
Description |
|
Jump to |
Jumps to the current step in the Steps panel. NOTE: Use a breakpoint to pause the task at a specific step. |
|
Help |
Opens the help topic regarding this debug tool. |