beSTORM FAQs
The monitoring component of beSTORM is installed on the server where your product is installed, and you can install the component that initiates testing on the same server, or on a separate machine on your network to increase throughput and allow more realistic testing scenarios.
For more information on installing beSTORM in Windows-based environments, see the beSTORM Windows Installation Guide.
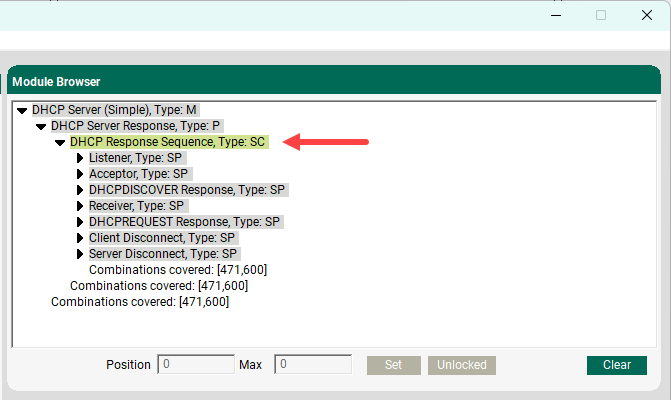
With every protocol you purchase, you can see a complete list of fields and methods. Each protocol definition (the RFC or equivalent) is designed to include all available fields and methods, and you have the ability to review the protocol definition and make a request to add anything missing (extensions, etc.). You can also open the Module Browser pane to view beSTORM decision tree which displays all relevant test combinations:
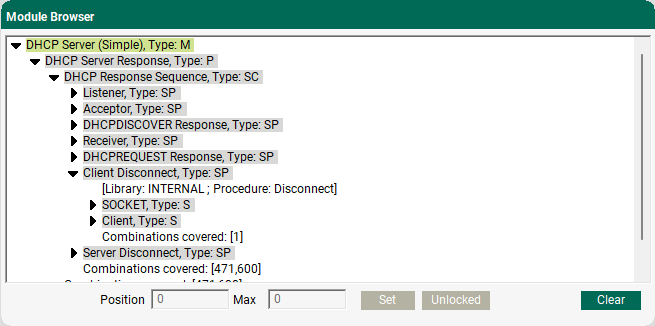
The full specs for protocols are not available prior to purchase. However, the total number of combinations is around 600 million for DHCP.
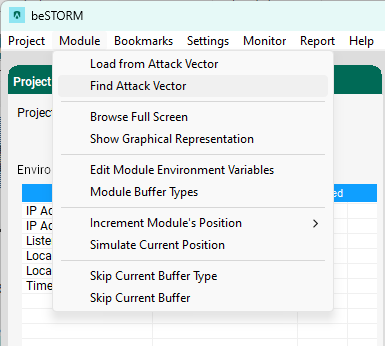
Yes. If you want to retest and you know the time the tests last ran, then you can return to them. To relaunch the tests and see all the attack vectors in the beSTORM Client, select Module > Find Attack Vector.
No. beSTORM expects you to send traffic to the beSTORM IP and not to the broadcast address. The beSTORM DHCP Server module does not support broadcast address traffic.
Yes. By default, TCP flags are not set. You can set and then “lock” the TCP values (for example, this method works for the TCPv4 module).
By default the flags are not set, you can set them and then “Lock” them to the value you want, this is assuming we are discussing he TCPv4 module. This also allows you to always use the target IP address, preventing beSTORM from fuzzing abnormal IP formats after a basic test was performed.
Linux monitoring offers several options to monitor your process. The first option is to use GnuDB (debugger). GnuDB is an open source and widely available debugger you can instruct to inform beSTORM whenever an exception occurs. A sample script that preforms this is located in the beSTORM installation folder (gdb_monitor.pl).
In some cases, debugging is not possible as the process can spawn new child processes, is a kernel module, etc. In those cases, you can use a non-debugger beSTORM monitor agent.
For example, the bestorm_tail.pl script (included with beSTORM) follows a provided file and looks for specific strings. It will then pass the strings to beSTORM to report that some failure/exception has occurred. If the more common SEGFAULT string is found inside a program's log file, this indicates that a segmentation fault (a crash, usually unhandled) has occurred.
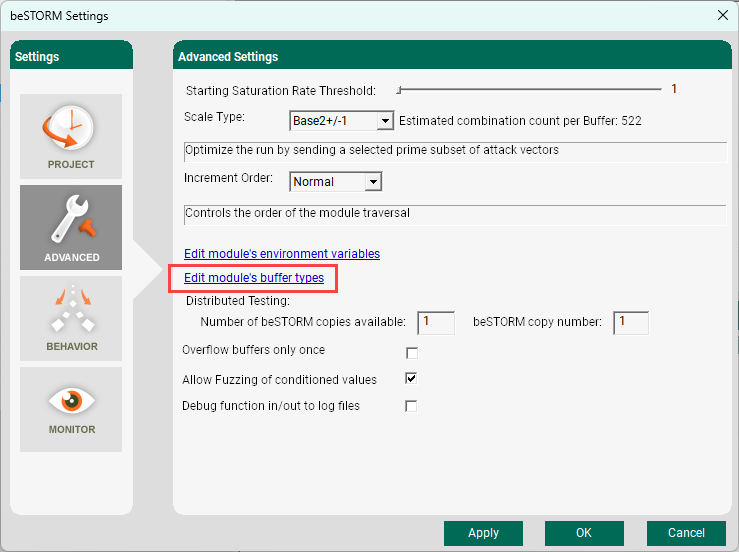
To customize the buffer type for a project, do the following:
-
Open beSTORM Client.
-
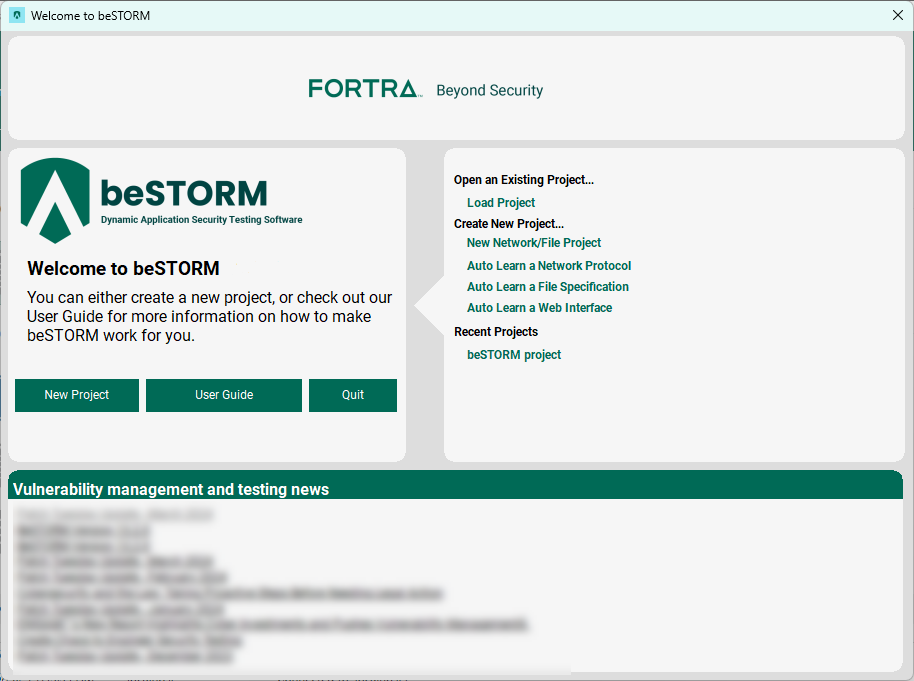
On the Welcome to beSTORM window, select Load Project.
-
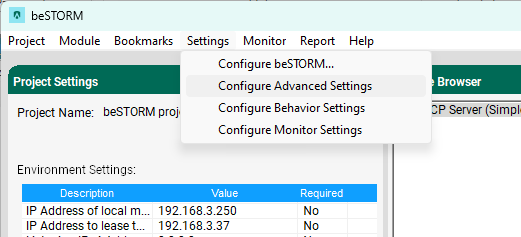
Select Settings > Configure Advanced Settings.
-
Select Edit module's buffer types.
-
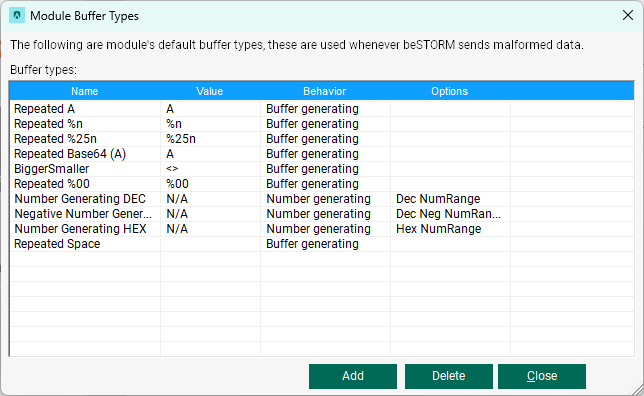
To add or delete modules, do the following:
-
To delete a module, select it, and then select Delete.
-
To add a module, select Add, and then select a hex or number-based buffer type.
-
If a potential weakness/vulnerability is found, you can use the script to run the same attack to see the behavior of the DUT (this is especially helpful during the remediation process). Once the script is saved, you can edit the script for continued testing on the user end.
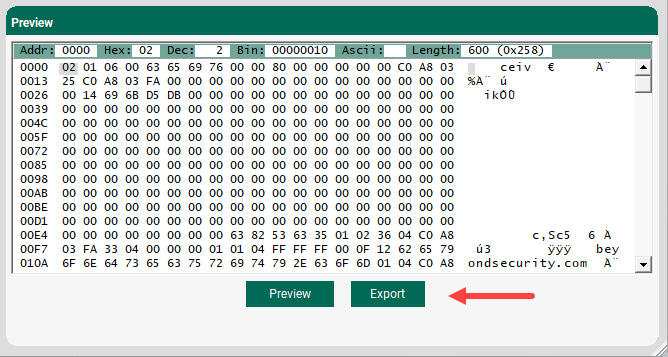
beSTORM has a built-in option built that allows you to export attacks that are used as Perl or Python scripts. To export these scripts, do the following:
-
Open beSTORM Clent.
-
Select New Project or load an existing project.
-
Once the beSTORM Client window is open, select the attack vector to export from the Module Browser pane.
-
In the Preview pane, select Export.
-
In the Save as type box, select Python3 Files or Perl Files.
-
Select Save.
For information on replaying attacks in beSTORM, see the following video:
Supported hardware
beSTORM currently supports the following CAN bus hardware devices:
-
PCAN-USB - a USB-to-CAN device.
-
PCAN-USB FD - a USB-to-CAN device that supports CAN and CAN FD.
-
Intrepid ICS CAN - a USB-to-CAN device.
-
ValueCAN 4-2 - Low-Cost High Performance CAN FD - USB Interface with IP65 Aluminum Enclosure.
beSTORM API support
beSTORM currently supports all three devices, with many CAN modules available separately for each device. beSTORM uses the device’s API to correctly set the CAN bus.
Requirements from a future device
To add or change a device using our existing CAN bus modules, it must support the following functions:
-
A function that opens the interface to CAN bus, which is wrapped inside a OpenDevice call (that is, a custom DLL that must be written). See the OpenDevice example below.
-
A function that closes the interface to CAN bus, which is wrapped inside a CloseDevice call.
-
(optional) A function that configures the CAN bus settings (speed, bit parity, etc.). which is wrapped inside a SetGlobals call (this can be “empty” if these settings are provided through a third-party configuration tool and do not need to be performed by beSTORM).
OpenDevice example
Intrepid ICS CAN:
bool res = icsneo_openDevice(&choosenDevice);
Yes. As one example, if you enabled and then fuzzed jumbo packets (TCP) (which is not enabled by default on most OS systems), that would be a unique setup that others aren't checking.
Yes. beSTORM can integrate with Jenkins by running in a headless version. beSTORM can also run within Gitlab CI as well. However, you must run the Linux version of beSTORM with a prepared module configuration file.
To only test certain fields and not the entire protocol (for example, only test POST and skip GET on HTTP), you must lock fields to specific values. You can do this using these two methods:
-
Above the POST/GET branches, locate the Enumerator (SE element). Set the lock to on for that element, and then change the position from 0 to 1 so that it's now the second branch. Only the second branch (POST) will now run. Right-click the POST branch, and then select a priority that is greater than 5. The branch now has a higher priority and will run first. In this scenario, you are still testing GET, but only AFTER all the POST tests are done.
-
Right-click the POST branch, and then select a priority that is above 5 (for example, 6). The branch now has a higher priority and will run first. In this scenario, you are still testing GET, but only AFTER all the POST tests are done.
beSTORM tests the binary application, and is therefore completely indifferent to the programming language or system libraries used. This allows a separate testing team that may not have access to the source code to use beSTORM for security testing of the application.
beSTORM will report the exact interaction that triggers the vulnerability. You can send this report to the programmers, and they can now debug the application in the desired development environment to see what causes the fault.