beSTORM Monitoring
Overview
beSTORM comes bundled with several sample monitors:
-
The SNMPMonitor.java monitor utilizes the SNMP protocol to determine whether the remote host's SNMP agent is alive.
-
The gdb_monitor.pl, c monitors utilize the GNU Debugger to attach to the process and send a notification whenever the debugger detects that an error has occurred.
-
The bestorm_tail.pl and bash_monitor.sh (which tail a log file based on detected strings) inform beSTORM whenever something out of the ordinary has occurred.
Monitoring consists of sending traffic to beSTORM traffic on two ports by way of UDP packets, 6969 and 6970:
-
6969 allows you to notify beSTORM that an exception/vulnerability/a problem with the product has been detected - whatever you send to this port will get documented, up to 64K.
-
By way of communication on port 6970 (UDP), you can control beSTORM. All commands return either the command issued followed by a FAILURE or SUCCESSFUL string except NOOP, which returns a timestamp.
In most cases, it is sufficient for the monitor to send the NOOP command (which means sending N O O P without spaces) to the remote beSTORM installation to let beSTORM know you are alive, and then stop sending the command when it wants to inform that something needs to be reported to the user.
Available commands
| Command | Description | Response |
|---|---|---|
| NOOP | Informs beSTORM that the monitor is still alive. | Returns NOOP followed by a timestamp. |
| EXCEPTION | Any text that follows this string will be handled as an exception data that needs to be reported to the user as a possible vulnerability. | Returns either EXCEPTION FAILURE if it failed to log the exception or EXCEPTION SUCCESS if it was successful. |
| ERROR | Any text that follows this string will be handled as an error data that needs to be reported to the user as a possible problem with the testing process. | Returns either ERROR FAILURE if it failed to log the exception or ERROR SUCCESS if it was successful. |
| UP | Request beSTORM to speed up. | Returns either UP FAILURE if it failed to log the exception or UP SUCCESS if it was successful. |
| DOWN | Request beSTORM to speed down. | Returns either DOWN FAILURE if it failed to log the exception or DOWN SUCCESS if it was successful. |
| FINISH | If beSTORM is currently in PAUSED mode, beSTORM will move to FINISH mode which means that it will allow you load another project if required. | Returns either FINISH STOP FIRST if beSTORM is still running and cannot be put into FINISH mode or FINISH SUCCESS if it was successful.
|
| STOP | Request beSTORM to switch to PAUSED mode. | Returns either STOP FAILURE if it failed to log the exception or STOP SUCCESS if it was successful. |
| START | Request beSTORM to switch to RUNNING mode. | Returns either START FAILURE if it failed to log the exception or START SUCCESS if it was successful. |
| STATUS | Request beSTORM's current status. Possible values are PRE_RUN, RUNNING, CONCLUSION, FAILURE, PAUSED, UNKNOWN and UNSET, the last two status values should be regarded as a failure of the beSTORM program and it is recommended that beSTORM is restarted. | --- |
| EXIT | Request beSTORM to shutdown/exit. | Returns either EXIT STOP FIRST if beSTORM is still running and cannot be put into FINISH mode or EXIT SUCCESS if it was successful. |
| LOAD | Request beSTORM to load another beSTORM project (settings.bsp file), any text the follows this string will be used as the file to load (for example, LOADc:\project\settings.bsp). | Returns either one of these:
|
| SAVE | Request beSTORM to save the current beSTORM project. | Returns either SAVE STOP FIRST if beSTORM is still running and cannot save, or SAVE SUCCESS if it was successful. |
| VECTOR | Request beSTORM to load a specific Attack Vector (for example, VECTORM0:P0:B0.BT0:B0.BT0:B0.BT0:SE0.CC0:SR3(L0:B0.BT0.L5:B0.BT0.L10:B0. BT0).E2.E3). | Returns either one of these:
|
| COUNTEXCEPTION | Returns the number of exceptions found so far. | Returns either COUNTEXCEPTION SUCCESS (Count: …) with the number of exceptions recorded, or COUNTEXCEPTION FAILURE if it was not possible to return the number of exceptions. |
| RETURNEXCEPTION | Returns the data captured for a certain exception. | Returns either one of these:
|
| SETTINGSCHANGED | Returns whether the current project's settings have changed (due to beSTORM running or user intervention). | Returns SETTINGSCHANGED SUCCESS (Code: %d) either the value of 0 or 1 – either false or true respectively. |
| STATS | Returns the total number of sessions generated up to this point as well as the current SPS (momentary value, not average). | --- |
| CURRENTVECTOR | Returns the current attack vector beSTORM is at. | --- |
| INCREMENTVECTOR | The command is followed by a positive number from 1 and up. The command will move the module's position by the provided number. Every 5000 increments a status response is sent to provide feedback to the progress (as increments might take a few seconds to complete). For example, INCREMENTVECTOR1000, This will increment the module by 1000 attacks. | --- |
| RETURNVECTORS | The command is followed by a full path and filename, the tab character (0x09) and the number of vectors to dump. The full path and filename will be used as the storing place for dumping the vectors. For example: RETURNVECTORSC:\TEMP\DUMP.TXT\t1000. (In the above sample the \t was used to distinguish that we are supposed to put a TAB character there) After the command finishes, the file, C:\TEMP\DUMP.TXT will contain 1000 attack vectors from the current position of the module up to the 1000th position |
--- |
| RUNFOR | The command is followed by a number. The number tells beSTORM how many combinations (attack vectors) to go through. If used in combination with VECTOR and RETURNVECTORS you can beSTORM run in a distributed manner by combining a VECTOR to load a pre-fetched vector returned by the RETURNVECTORS command, RUNFOR 1000 combinations to prevent it from testing more the pre-fetched interval.
|
--- |
Microsoft Windows monitoring
One of the complementary tools beSTORM provides is a monitoring tool that attaches to the tested application or service and reports back to beSTORM all relevant information concerning exceptions, crashes, and various errors. This allows both the user to have more relevant information for reproducing the problem and detecting its cause, and beSTORM to control the test progress.
The beSTORM monitor communication allows beSTORM to log vulnerability information, stop test if necessary, wait while tested server is on high load, increase test speed if possible and auto-start tested server in case of crash to automatically resume the beSTORM test.
beSTORM monitor interfaces for Windows
beSTORM monitor has two interfaces for monitoring Windows:
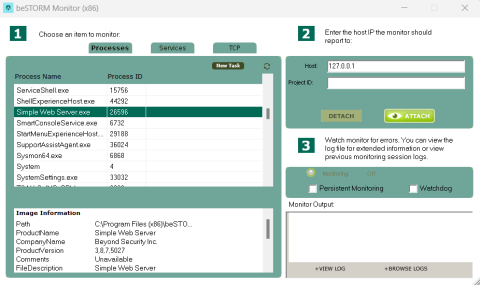
To monitor Windows using the GUI interface
-
Open beSTORM Monitor.
-
Select the desired process/service from the Process Name list.
-
Enter the desired host IP address in the Host box.
-
Select Attach.
To monitor Windows using the Console interface
-
To monitor a process, run Monitor.exe --attach_pid <Process ID of the process we wish to monitor>--host <Host to report to>.
-
To monitor a service, run Monitor.exe --host 127.0.0.1 --register_debugger <Service executable name here, with extension>, and then restart the service.
-
To stop monitoring a service, run Monitor.exe --unregister_debugger <Service executable name here, with extension>, and then restart the service.
To view the full usage, simply run the application with no parameters and it would be displayed on screen.
In addition, beSTORM provides use of the same functionality with different monitors/debuggers such as gdb, OllyDbg or even your own proprietary monitoring tool. Since communication is through a UDP protocol, this allows you to best suit the monitoring process to your test scenario or setup lab.
For Windows, the OllyDbg and WinDBG components are provided for debugging.
For OllyDbg support, copy the enclosed OllyDbgbeSTORMPlugin.dll file to your OllyDbg installation folder and start OllyDbg as usual. beSTORM is notified for every pause event triggered in OllyDbg. See the OllyDbg.ini file for extra configurations or use the added beSTORM configuration GUI.
For WinDBG support, copy the enclosed MSEC.dll file to your WinDBG winext directory under the WinDBG installation directory, modify the beSTORM supplied windbg.txt script to correctly point to your beSTORM's client IP address and call the script from within windbg.txt
Linux monitoring
For Linux monitoring you have several options to monitor your process.
The first option is to use GnuDB (debugger). You can instruct this open source and widely available debugger to inform beSTORM whenever an exception occurs using the gdb_monitor.pl, gdb_monitor.py, and gdb_monitor_python3.py scripts (located in the beSTORM installation folder). For more information, see How does the monitoring process for Linux work? (13.4.0 or later) on Fortra's Beyond Security Portal.
In some cases, debugging is not possible as the process spawns new child processes or is a kernel module. In these cases, you can use a non-debugger beSTORM monitor agent.
For example, one of the monitors that comes with beSTORM is the bestorm_tail.pl. This script follows a provided file and looks for specific strings to pass to beSTORM to inform it that some failure/exception has occurred. One of the most common strings you can look for is SEGFAULT which if found inside a log file generated by a program, indicates that a segmentation fault (a crash, usually unhandled) has occurred.
Monitor template
If the service or device you are trying to test is not compatible with the beSTORM Monitor, but you can check its state using Python, consider using the monitor_template.py script (located in C:\Program Files (x86)\beSTORM\Monitors).
This script provides a blueprint for a simple monitor by filling the check_DUT_error() and connect_to_DUT() functions so you can run it as a command to monitor anything you want.
The monitor will connect to a beSTORM project and the device under test (DUT). If the DUT disconnects, the monitor will notify beSTORM to identify vulnerabilities and match them with the beSTORM packet that caused the disconnection.
-
If the DUT requires a prior connection or set up, fill the connect_to_DUT() function with the necessary code.
-
Fill the check_DUT_error() function with code that can check if your device is active or not. The monitor will use the function to check that it is connected, and then send an exception to beSTORM.
CopyExample
def check_DUT_error():
    if my_DUT_had_an_error:
        return True
    else
        return False

The monitor will interpret a True output as a disconnection and send it to beSTORM -
Create the beSTORM project.
NOTE: It is recommended that you clear the Auto-start beSTORM scan now checkbox option so that the monitor can connect before the fuzzing is started. -
Run the script from the command-line to connect the monitor to beSTORM and the DUT. You can use the following arguments:
Argument Description -A / --address - The IP address of the beSTORM computer (this is the only mandatory argument). -H / -heartbeat_time - The time between each heartbeat sent to beSTORM (default 1 second). -E / --checkerrors_time - The time to wait before checking the DUT status (default is 1 second). -P / --persistent - Activates persistent mode (instead of disconnecting upon finding a vulnerability, the monitor will keep trying to reconnect to the DUT) (default is False). -W / --persistent_waittime - The total amount of time that the monitor will try to reconnect while in persistent mode (requires persistent mode) (default is 120 sec). -L / --log - The path to a file where logs will be stored (default is None).
To add more command arguments, expand the get_args() function.
To modify the exception and heartbeat port from the default, change them in the send_exception() and start_notifier() functions respectively.
To modify the exception message in beSTORM, expand the send_exception() function.