You can run a report manually, at any time, to view the current results. The Reports Center displays your report graphically and enables you to explore the results in more detail. You can also export or email the report as a PDF file, or save the data as a CSV.
|
A system report |
 is one of the standard reports
supplied with
is one of the standard reports
supplied with How do I...
-
 View a Report?
- Navigate to the Report Center Home page.
-
Locate the report from the list of available reports.
If you know the name of the report, use the Search area to filter the list to match your search. Alternatively, use the  or
or  icons to filter each report category.
 - Select the report. A description is displayed in the panel on the right.
- Click
 View (or double-click the report name). The report is displayed.
-
Examine report results?
When you view a report, the report results are displayed in a new pane in your web browser. Report data is presented in the following format:
Summary Area
The summary area displays the search criteria used to generate the report, including the date range selected.
The Date Range displays the start and end dates of the selected period. For example, if you selected This Week as a date range, the explicit dates defined by the period are also displayed. Report Data Area
Report data is presented graphically.
Click the chart to change the format between bar chart, pie chart and line graph. Results Table
The table displays results in rank or date order, depending on the report.
You can explore the results by clicking entries in the results table.
Reports might be grouped by week or month as requested. Use the Total button  to view Grand Totals or Subtotals for each period.
 -
Explore individual records?
Certain report types enable you to explore individual records in much more detail.
-
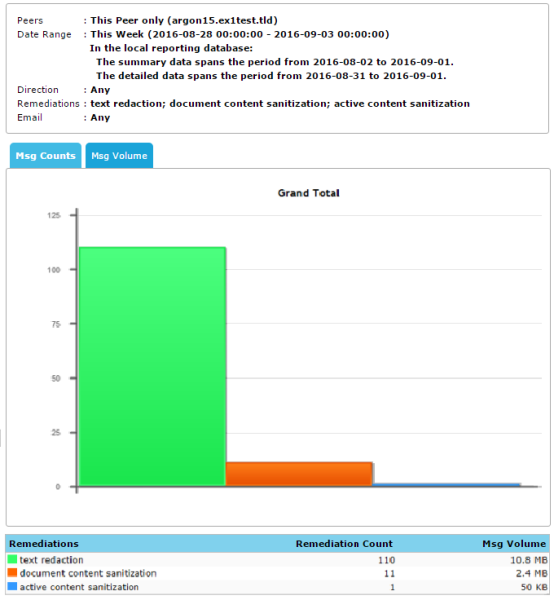
Example: How do I view a Redaction & Sanitization Summary report and explore the results?
- From the Report Center Home page, select Remediation in the Available Reports section.
-
Select the Redaction & Sanitization Summary report from the list of available system reports. Click View. The report is displayed. The results table displays categories and statistics about the number and size of records contained in each category. Show me.
-
Click the Threat category you want to explore. For example, you may want to examine the instances which were specifically Blocked by Route.
If there are sub-categories, you can continue to click each one, until individual records are displayed.
The report is redisplayed in a new pane in your web browser, each time you select a category or sub-category.
-
-
Export a Report?
You can export a report as a PDF or CSV file. You can also email a report as an attachment.
- Generate the report from the Report Center Home page.
-
Click Export To and select the option you require from the drop-down menu.
- PDF: Reproduces the report as an open PDF file.
-
CSV: Exports the report as a comma-separated values file.
-
Email: Sends the report as a PDF attachment.
PDF files are designed to reproduce the report data concisely and efficiently. Export the report as a CSV if you want to view the full report in detail, or you want to manipulate the data.
- Click Go. You can then open, save or email the report (depending on the option you selected) using the dialog box displayed.
-
Create a Customized Report?
You can create a customized report (using an existing system report as a template). See Creating Customized Reports for more information.
-
Modify a Report?
To modify the date range or other parameters, select the report from the Available Reports list and click
 Edit.
Edit. Only customized reports
 can be modified. For more information, see Modifying a Report.
 -
Schedule a Customized Report
You can configure a report to run at scheduled intervals. This scheduled report can be emailed automatically to a recipient of your choice. See Scheduling a Customized Report for more information.