Use the following displays and options to navigate through the Event Manager Timeline display.
The Event Manager menu bar
The Event Manager display contains a menu bar that provides access to features, configuration options and common functionality found within Event Manager.
Display Selection
Use the  down arrow to select another display from:
-
Event Manager Overview
-
Forensic Analysis Overview
-
Forensic Analysis Timeline
Compliance Views
Compliance Views are available by clicking the View icon ![]() in the menu bar. This displays the list of currently defined Standard and User-defined views.
in the menu bar. This displays the list of currently defined Standard and User-defined views.
Incidents, Threats, and Highlights Summary Totals
In the Event Manager header bar, a summary of all the open incidents, threats and highlighted events is shown. This gives a quick, at-a-glance view of what is currently posing a security risk against your business assets.

The summary counts are taken from the events for each audit control against which an event has been logged.
Configuration
Click the ![]() Configuration icon top open the Event Manager configuration options. These options are detailed in the Powertech Event Manager Configuration Guide.
Configuration icon top open the Event Manager configuration options. These options are detailed in the Powertech Event Manager Configuration Guide.
Applications
Click the ![]() Applications icon to display a drop-down menu displaying other Fortra applications such as Vityl IT & Business Monitoring and Insite. Click on an application to go to the selected option.
Applications icon to display a drop-down menu displaying other Fortra applications such as Vityl IT & Business Monitoring and Insite. Click on an application to go to the selected option.
User Settings
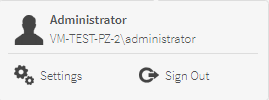
Click the ![]() User Settings icon to display a drop-down menu showing the name of the current user logged into this session. Also available from this display are the individual settings for this user and the option to sign out of the current session.
User Settings icon to display a drop-down menu showing the name of the current user logged into this session. Also available from this display are the individual settings for this user and the option to sign out of the current session.

Showroom
Click the Showroom logo to go directly to the Event Manager options display.
Search
Use the search box to pinpoint a specific entry or list of similar items with the same characteristics.
Type the full alphanumeric text of the entry that you want to search and press Enter. Alternatively, enter the partial text and use the wildcard '*' to search for all entries that match the text and wildcard pattern. For example, typing LocalHost and pressing Enter will find all entries containing LocalHost. Typing Loc* finds any entry that begins 'loc', and typing *loc* will find any entry that contains the letters 'loc' in the middle of the text.
Time Range
The Time Range setting within Event Manager can be used to amend the current display to a specific time band, so that the listed events can be as recent or as historic as needed.
Click Time Range in the Event Manager menu bar to display a drop-down menu from which a time range period selection can be made. Once a new time range is selected, the display changes to the show the events recorded in the selected time period.
Regulations
The Regulations setting can be used to limit the events displayed to just those impacting on a specific, or number of International and/or internal security regulations, that must be met in order for your business to remain in compliance.
Click Regulations in the Event Manager menu bar to display a drop-down menu from which a single or multiple regulation selections can be made. Click OK to apply the setting. Once the selected criteria have been applied, the display changes to the show the events that currently affect these regulations.
Controls
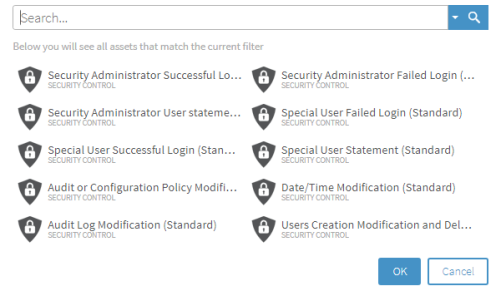
The Controls setting can be used to limit the events displayed to those that just match a specific, defined Security Control. When selected, all the Security Controls that match the current filter are displayed.

Select one of the existing controls from those listed or type a new control on which to search into the Search box and press Enter or click  to initiate the search. Press OK to apply the security control filter to the Event Manager display.
 in the Search bar to display a list of search examples and Attributes that can be used to retrieve the required Security Controls.
 Assets
The Assets setting can be used to limit the events displayed to a single asset type.
Type the required asset type, for example AIX, Windows or SQL in the search box and press Enter. All the defined assets that match the entered type are displayed. Press OK to apply the asset type filter to the Event Manager display.
Hide or Show Closed Events
Within the main display of the dashboard, it is possible to show or hide events that have been closed by users of the Event Manager.
Use the slider control in the Event Manager menu bar to show or hide closed events as required. The default setting is to hide closed events.

Autorefresh
Use the slider control to turn Autorefresh on and off. When autorefresh is enabled, the screen is automatically updated with new events at the set frequency. The default setting is 300 seconds. To change the frequency, click the frequency icon ![]() and enter a new time interval in seconds. The minimum value is 120 seconds.
and enter a new time interval in seconds. The minimum value is 120 seconds.

Refresh
If Autorefresh is not enabled, use the  Refresh button to update the Event Manager display with any security information that has been generated since the Event Manager option was reopened. Should a new event occur before the screen has been refreshed, a red dot appears above this icon to indicate that a new event has occurred and will be displayed on the next refresh.

Reset Filters
Use the  Reset Filters button to cancel any filter settings currently applied to the display and show all of the unfiltered events.
Bulk Review of Events
Rather than going into each event separately and reviewing it, it is possible to perform a bulk review of events and apply the same condition to all the events in a single action. There are two ways of performing a bulk review.
- Applying a Multi-select Option to Every Event on the Page
- Selecting All Events That Match This Filter
Applying a Multi-select Option to Every Event on the Page
This can be achieved by clicking in the square of the first column in the header bar as shown in the screen shot below.

All events on the page are now selected. The following options can now be taken.
- Change Reviewer: Click Change Reviewer to open the Change Reviewer window from where a new reviewer can be chosen and applied to all the selected events.
- Add Comment: Enter a comment in the comment box and click the
 Comment icon to apply the same comment to all the selected events.
 - Close: Click the
 Close icon to open the Close Confirmation window where a comment can be added to explain the resolution.
Click Refresh to update the display with the result of the bulk action review.
Selecting All Events That Match This Filter
Click in the square of the first column in the header bar as before when applying a multi-select option to every event on a page.
Click Select All Events Matching This Filter.
This performs a bulk review on any events that match the filter, regardless of the page on which it is located.
You have the same options as available as when applying a multi-select option to every event on a page.
Click Refresh to update the display with the result of the bulk action review.
Display Options
Use the following controls and options to change the way in which the information in the shown in the display.
These options are found in the toolbar at the bottom of the Event Manager display.
Column Width
To change the width of any column in the display, hover the mouse pointer over the column boundary line in the column header that you want to extend, or narrow, until the point changes to a horizontal resize arrow  .
.
Left-click, and keeping your finger on the mouse button, drag the column border in the required direction. When you are satisfied with the new column width, release the left-button on the mouse and the display updates to reflect the new column size.
Column Order
Columns can be moved within the display but only in the section within which they are displayed by default. For example, it is not possible to move the Action column to the far left of the display as these columns are within the Event Information section.
Position the mouse pointer over the header of the column that you want to move and left-click. Keeping your finger on the mouse button, drag the column to the required position in the display. When you are satisfied with the new position, release the left-button on the mouse and the display updates to reflect the new column position.
Font Size
The size of the text in the display can be decreased or increased by clicking on the corresponding text icon.
Click  to decrease the font size.
Click  to increase the font size.
Multi-row display
By default, the Event Manager uses a multi-row format to display the security event information with the complete message being summarized into the available . While in this format, hover the mouse pointer over the Complete Message column to reveal the full content of the message detail.
With the display set to single-row format, event message detail is shown in full. Use the vertical scroll-bar to move through the list of security events.
The indicator at the bottom of the Event Manager display shows the current setting.
Click ![]() to display the security events in single row format.
to display the security events in single row format.
Click ![]() to display the security events in multi-row format.
to display the security events in multi-row format.
Select Columns
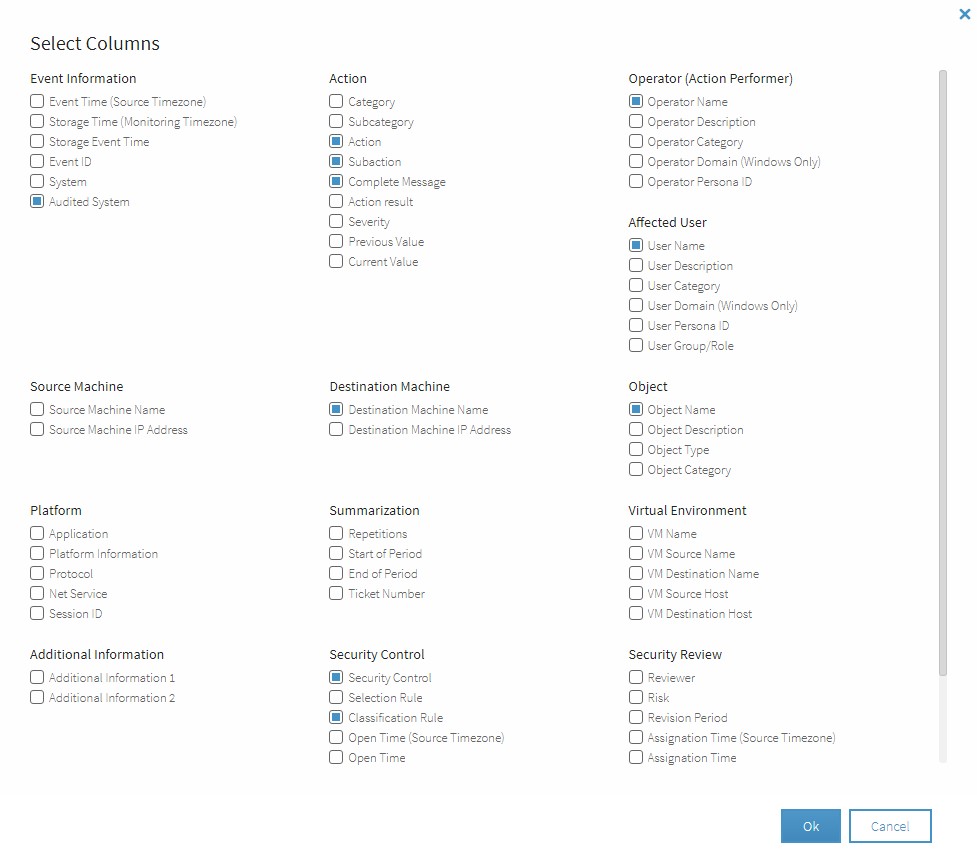
Click Select Columns to open a window that allows you to select new and remove existing columns from the Event Manager display.
Selected columns are indicated by a blue square. Click on these columns to remove them from the Event Manager display. Click on an unselected column to add it to the Event Manager display. Click OK to confirm the new column selection and amend the Event Manager display.
Group By
Use the Group By function to group together all security events of an identical type that appear on the current page.
Rows per Page
Use the Rows per Page function to change the number of rows that are shown per page when the multi-row display format is selected.

Use the drop-down menu to select from either 10, 25, or 50 rows per page.
Page Navigation
There are three options that can be used to navigate through the pages of security events logged in Event Manager.

|
Click to move the display forward one page |

|
Click to move the display back one page |

|
Click to return to the first page of the display |
Reset Grid
Click the  Reset Grid icon to reset the current grid values for column width, column order and filters, for example to the default values.

