McAfee® ePolicy Orchestrator® (McAfee ePO™)
McAfee® ePolicy Orchestrator® (McAfee ePO™) software and Fortra’s Fortra Vulnerability Management(Fortra VM) offer an integrated solution to provide organizations with clear visibility into managed and unmanaged devices. Rapid, automated deployment of threat detection agents on unmanaged devices results in bolstered security, while reducing the resources required to administer security threat protection and compliance programs.
To integrate with McAfee® ePolicy Orchestrator®, perform the following (see below for detailed instructions):
- Install the Fortra VM extension on the McAfee ePO Server.
- Configure registered server.
- Schedule server task to pull data.
- Schedule additional server tasks.
- View your Fortra VM integrated data in McAfee ePO.
Requirements
- ePO 5.3.2 or later
- FrontlineVM.zip Integration Package
- Fortra VM API Key
Generate a Fortra VM API Key
-
Log in to Fortra VM.
-
In the site heater, select your name and choose My profile.
-
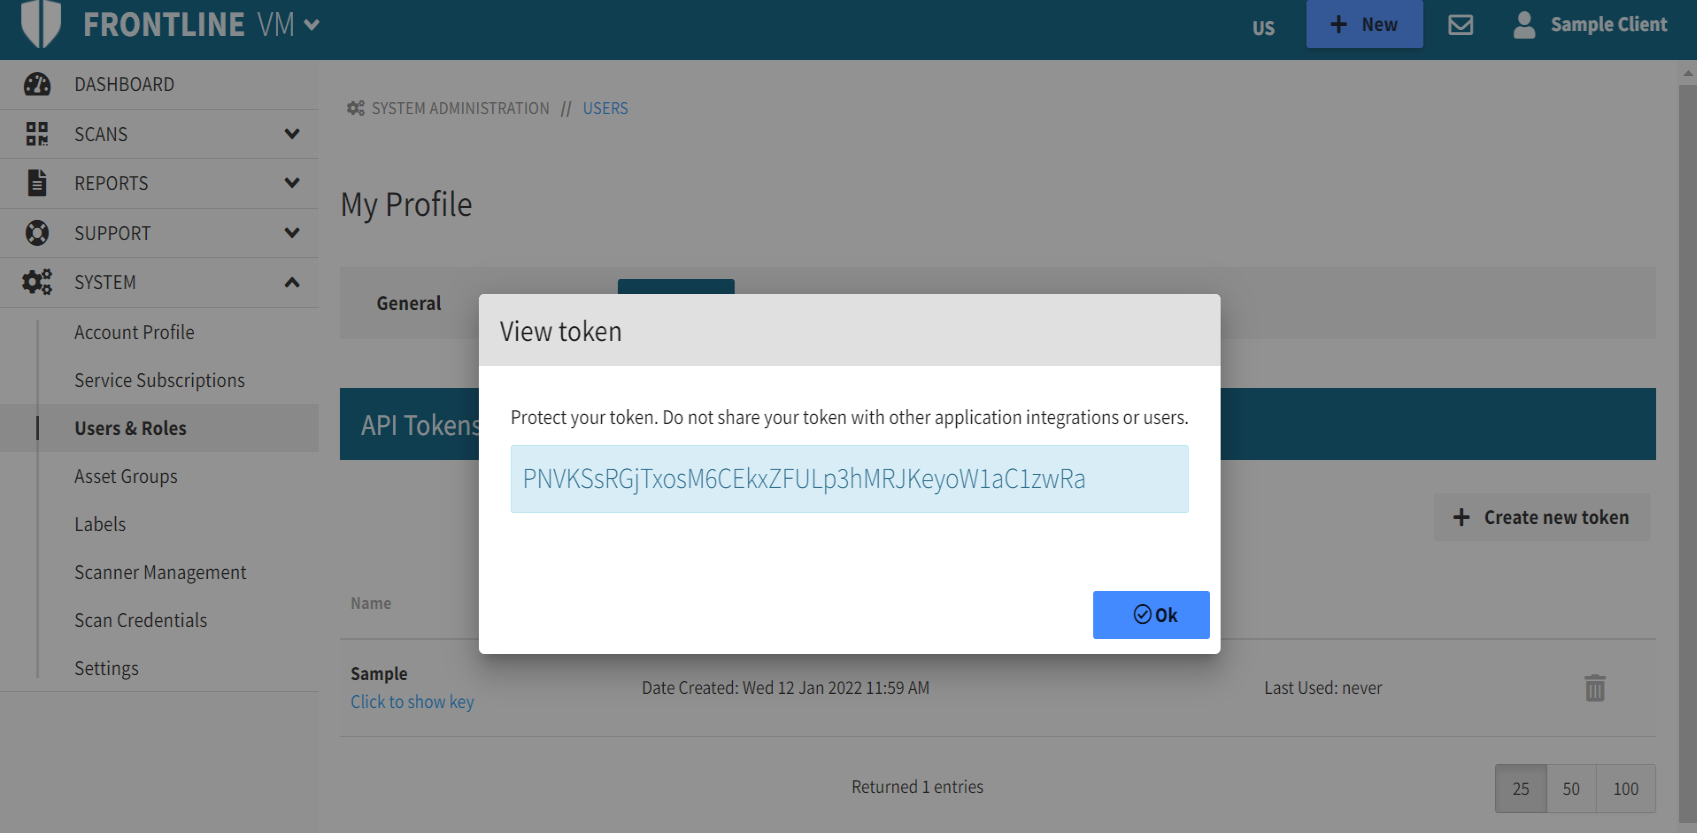
On the API Tokens tab, select Create new token.
-
In the Add New Token dialog, type the token name and select OK.
-
Below your token name, selecting Click to show key displays your API Key.
Install Fortra VM Extension
In order to integrate McAfee ePO with Fortra VM, you must first install the Fortra VM extension.
- Download the FrontlineVM.zip Integration Package.
- Open the ePO Console.
- From the menu , under Software, select Extensions. You are now on the Software Extensions page.
- Select the Install Extension button.
- Select Choose File, browse for the downloaded extension and select Open.
- From the summary screen, select OK.
The Fortra VM extension will now appear on the left panel of the Software Extensions page. The Fortra VM Hosts and Vulnerabilities extension tables will now appear in the ePO menu under Third Party. However, there will not be any Fortra VM data available until you configure the registered server and run a server task to pull data.
Configure Registered Server
In order to connect McAfee ePO to Fortra VM to pull data, you must configure a registered server with your Fortra VM API Key.
- From the menu , under Configuration, select Registered Servers. You are now on the Registered Servers page.
- Select New Server.
- For Server Type, select Fortra VM. Enter a name for the registered server, such as Fortra VM Server and optional notes.
- Select Next.
- For the Fortra VM URL, enter “https://vm.frontline.cloud/”.
- For API Key, enter your previously generated API Key.
- Select Check API Key.
You are now ready to schedule a server task to pull data from Fortra VM.
Schedule a Server Task to Pull Data
To view Fortra VM host, vulnerability and GPA data in the ePO dashboard, you must first schedule a server task to pull data from Fortra VM.
- From the menu , under Automation, select Server Tasks. You are now on the Server Tasks page.
- Select New Task.
- On the Description tab:
- Enter a name and notes for the task
- For Schedule Status:
Select Enabled if the task will be scheduled (automated). - Select Next.
Select Disabled if the task will not be scheduled (not recommended).
NOTE: When Schedule status is set to disabled, the server task must be run manually. - On the Actions tab:
- From the Actions drop-down, select Digital Defense: Fortra VM Data Pull.
- For Server Name, select the Fortra VM registered server.
- For Minimum Severity Level, select the minimum security level you want to import. For instance, selecting Medium will import all vulnerabilities with a severity level of Medium, High and Critical. TIP: It is recommended that you start with Critical or High to limit the volume of data imported.
- Select Next.
- On the Schedule tab:
- Select a schedule type, start date, end date and enter schedule details.
- Select Next.
NOTE: Leave blank if you selected disabled for Schedule Status. New data is only pulled if a new scan has been run in Fortra VM since the last data pull. - Select a schedule type, start date, end date and enter schedule details.
- On the Summary tab: Verify that everything is correct and select Save.
Your new data pull server task will now be listed under Server Tasks. You can manually run the task to pull data immediately, or wait until the task runs on its scheduled date and time.
Once a server task has been run, it will be listed on the server task log under Automation from the main menu.
Schedule Additional Server Tasks
Additional Fortra VM server task actions are available on the New Tasks window on the ePO Server Tasks page.
- Fortra VM RSD Import:The Rogue System Detection import pulls all known host data from Fortra VM to be compared with McAfee ePO data. Rogue systems are those that do not have the McAfee agent installed or are not communicating with the ePO server.NOTE: The McAfee RSD extension must be installed and configured in order to run the Frontline VMRSD Import action. Additionally, the Frontline Data Pull task must be run before performing the RSD import.
 To schedule the Fortra VM RSD Import server task:
- From the menu , under Automation, select Server Tasks. You are now on the Server Tasks page.
- Select New Task.
- On the Description tab:
- Enter a name and notes for the task
- For Schedule Status:
- Select Enabled if the task will be scheduled (automated).
- Select Disabled if the task will not be scheduled (not recommended). NOTE: When Schedule status is set to disabled, the server task must be run manually.
- Select Next.
- On the Actions tab:
- From the Actions drop-down, select Digital Defense: Fortra VM RSD Import.
- For Server Name, select the Fortra VM registered server.
- Select Next.
- On the Schedule tab:
- Select a schedule type, start date, end date and enter schedule details.
- Select Next.
NOTE: Leave blank if you selected disabled for Schedule Status. - Select a schedule type, start date, end date and enter schedule details.
- On the Summary tab: Verify that everything is correct and select Save.
- On the Description tab:
Your new RSD Import server task will now be listed under Server Tasks. The task will run on the scheduled date or time, but can also be manually run from the Server Tasks list. The Fortra VM Data Pull task must be run before you can run the RSD Import.
The Detected Systems can be found on the ePO menu , under Systems.
- From the menu , under Automation, select Server Tasks. You are now on the Server Tasks page.
- Fortra VM Scan Launch: Launch a single VM scan or schedule future scans for an IP or IP range. While a scan can be scheduled and run from , you can also create a McAfee ePO server task to run a scan directly from ePO. NOTE: In order to receive new data over a prior data pull, you must run a new scan. If a scan has already been run in the Fortra VM application, you do not necessarily need to schedule or run an additional scan via the ePO server task.To schedule the Fortra VM Scan Launch server task:
- From the menu , under Automation, select Server Tasks. You are now on the Server Tasks page.
- Select New Task.
- On the Description tab:
- Enter a name and notes for the task.
- For Schedule Status:
- Select Enabled if the task will be scheduled (automated).
- Select Disabled if the task will not be scheduled (not recommended). NOTE: When Schedule status is set to disabled, the server task must be run manually.
- Select Next.
- On the Actions tab:
- From the Actions drop-down, select Digital Defense: Fortra VM Scan Launch.
- For Server Name, select the Fortra VM registered server.
- Enter the start and end of the IP range to be scanned. For a single IP, enter the IP in the start and end fields. TIP: If scanning additional IP addresses or ranges, select the + to the right of the actions field.
- Select Next.
- On the Schedule tab:
- Select a schedule type, start date, end date and end of schedule details.
- Select Next.
NOTE: Leave blank if you selected disabled for Schedule Status. - Select a schedule type, start date, end date and end of schedule details.
- On the Summary tab: Verify that everything is correct and select Save.
- On the Description tab:
Your new scan launch server task will now be listed under Server Tasks. The task will run on the scheduled date or time, but can also be manually run from the Server Tasks list.
- From the menu , under Automation, select Server Tasks. You are now on the Server Tasks page.
View Fortra VM Data in ePO
The VM hosts and vulnerabilities tables can be found under Third Party section of the menu .
To see an overview of your VM data, select Dashboards from the ePO navigation bar.
From the Dashboards drop-down, select the Fortra VM dashboard.
The interactive dashboard allows you to drill down for more detailed information by selecting a graph element or list item. You can edit the dashboard or create your own and select relevant monitors to display.