SAP® Crystal Reports
FVM Connect™ allows the integration of the Fortra VM™ platform with SAP® Crystal Reports Business Intelligence (BI) reporting software. This allows you to create a Fortra VM data report, with your data, using templates authored within your own SAP Crystal reports software. FVM Connect is achieved by way of integration scripts.
To integrate with SAP Crystal Reports, perform the following steps (see below for detailed instructions):
- Generate a Fortra VM API Key.
- Install script and configuration file.
- Set up configuration variables.
- Access Fortra VM data definitions.
- Utilize Fortra VM data.
Requirements:
- Fortra VM™ version 6.0.38.0
- Crystal Reports.zip Integration Package
- Fortra VM API Key
- Python 2.7.15 or later and Python Package "python-dateutil" version 2.7.5 or later.
Generate a Fortra VM API Key
-
Log in to Fortra VM.
-
In the site heater, select your name and choose My profile.
-
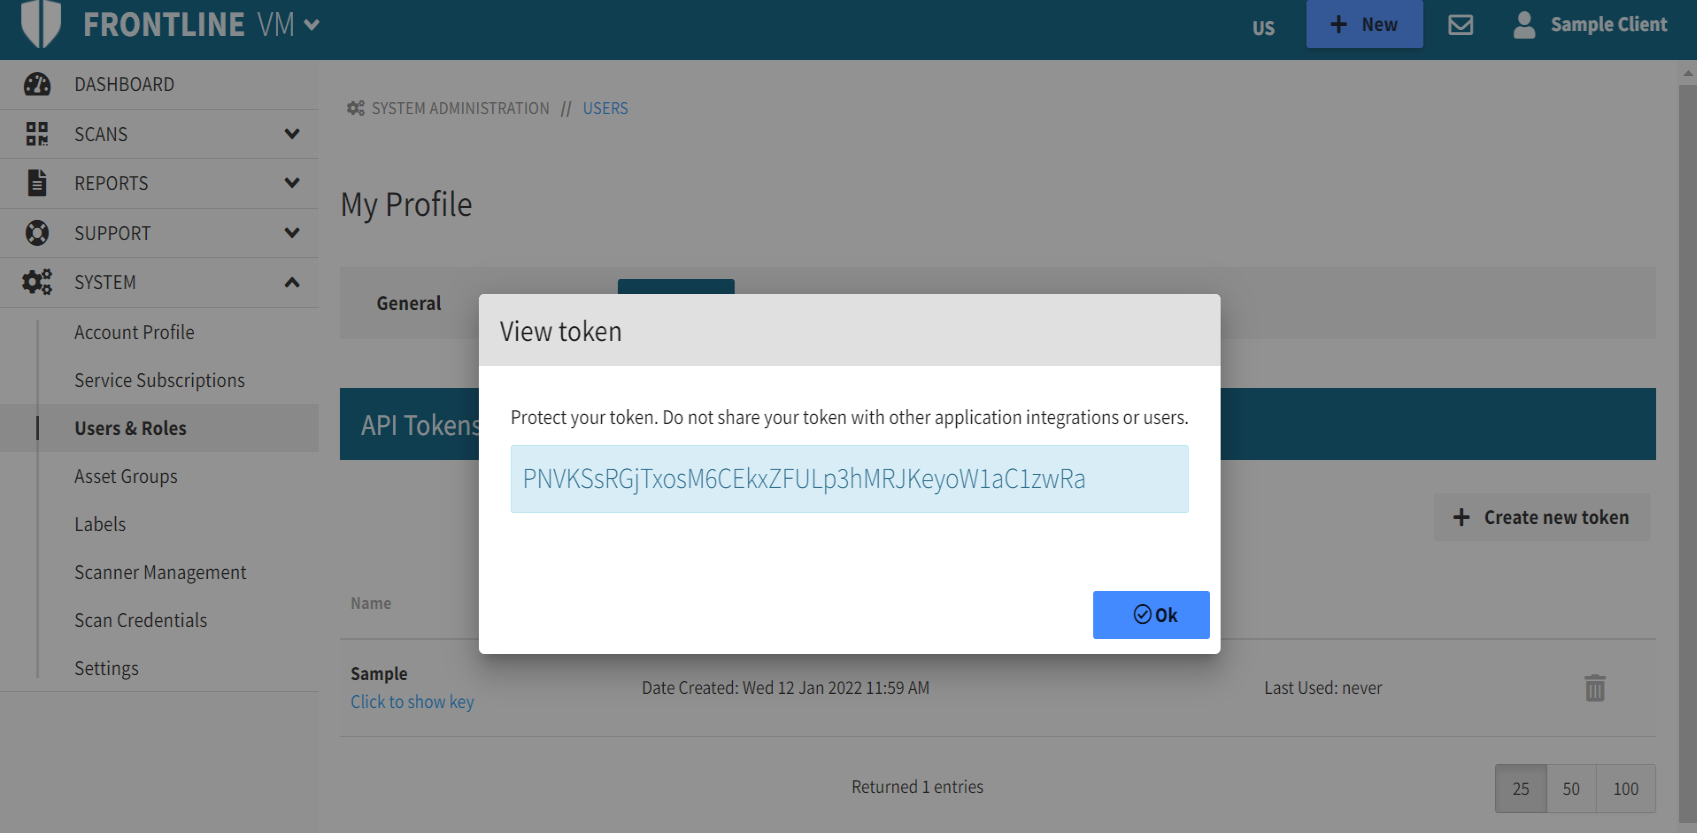
On the API Tokens tab, select Create new token.
-
In the Add New Token dialog, type the token name and select OK.
-
Below your token name, selecting Click to show key displays your API Key.
Install
The provided Python scripts are designed to pull Fortra VM data for your Fortra VM™, Pen Test™, and ATS™ scans. The data will include external as well as internal scan data for both unauthenticated scan results as well as authenticated scan results.
To install, place the script and configuration file in the same directory on a machine hosting Crystal Reports or a machine in which data is network-accessible to the Crystal Reports’ server. Using python’s package installer (pip), install the required packages from the
Set up
After both files are placed in the same directory on an appropriate machine or server and the required packages are installed, you are ready for set up.
Open
- api_token (REQUIRED)
- This field is required for the script to function properly. Enter the Fortra VM account API Token.
- data_path (OPTIONAL)
- Data is stored in a directory named FrontlineVM_data. Enter a path in which this directory will be stored (e.g., “
/root/data/”). - Default: the same path in which
“frontline.py” is stored.
- Data is stored in a directory named FrontlineVM_data. Enter a path in which this directory will be stored (e.g., “
Save and close the file.
Extracted Fortra VM Data
Below is a table describing the type of data being pulled from Fortra VM and the file name in which it is stored.
| Data Type | File Name | Data Description |
|---|---|---|
| Host | 00_Hosts.xml | This is the Active View Host client data for all of the user’s host assets. |
| Vuln | 01_Vulnerabilities.xml | This is Active View vulnerability data for all of the user’s vulnerabilities. |
| 02_VulnDictionary.xml | The vulnerability dictionary information for all vulnerabilities pertaining to the user. | |
| Dashboard | 03_Dashboard.xml | Client Dashboard data. |
| Graph | 04_GraphTopVulns.xml | Top vulnerabilities for this account (the given API Key) stored by criticality. |
| 05_GraphHostsRatingCount.xml | Host rating counts broken down at the present moment. | |
| 06_GraphMonthlyHostRatingTrend.xml |
Monthly Host rating trend. |
|
| 07_GraphMonthlyGPATrend.xml | Monthly GPA Trend. | |
| 08_GraphVulnSeverityCount.xml | Vulnerability Severity Counts. | |
| 09_GraphMonthlyNumVulnTrend.xml | Monthly trend for number of vulnerabilities. |
Usage
Using Fortra VM’s API this script will pull data from your Fortra VM account, convert and export XML files into the FrontlineVM_data directory.
Pulling Fortra VM Data
-
To pull all available data described above, execute the script using:
“python.frontline.py”
Pulling Selective FVM Data
- Pulling only specific types of data is possible using the optional
“--data” argument. There are only four valid arguments when using this option: host, vuln, dashboard, and graph. - For example, to pull only host data, execute the script using:
“python frontline.py --data host”
Multiple arguments are accepted. For example:
-
“python frontline.py --data host graph” will pull only host and graph data from Fortra VM. - Run
“python frontline.py --help” to view the list of available arguments.
FVM Connect Tutorial Guides
Creating a Vulnerability Summary Report
Adding Additional Information to Your Report
Sample Crystal Reports
- Critical Vulnerabilities Report
- Executive Dashboard Report
- Vulnerability Trending Reports
This is an executive report which lists all critical vulnerabilities, their titles, descriptions, solutions, as well as which IP hosts are impacted for both externally facing hosts as well as internally facing hosts. These include critical level vulnerabilities, as well as all issues found by the ATS system.
This report provides a dashboard view, similar to what is shown on your Fortra VM dashboard. The data includes all elements currently seen on the Fortra VM dashboard including the Security GPA trend information for both internal and external scan data; Rated Vulnerability Distribution; At Risk Assets, and Vulnerabilities You Should Fix.
This report provides monthly vulnerability trending graphs for both external scans as well as internal scans.