Threat Landscape
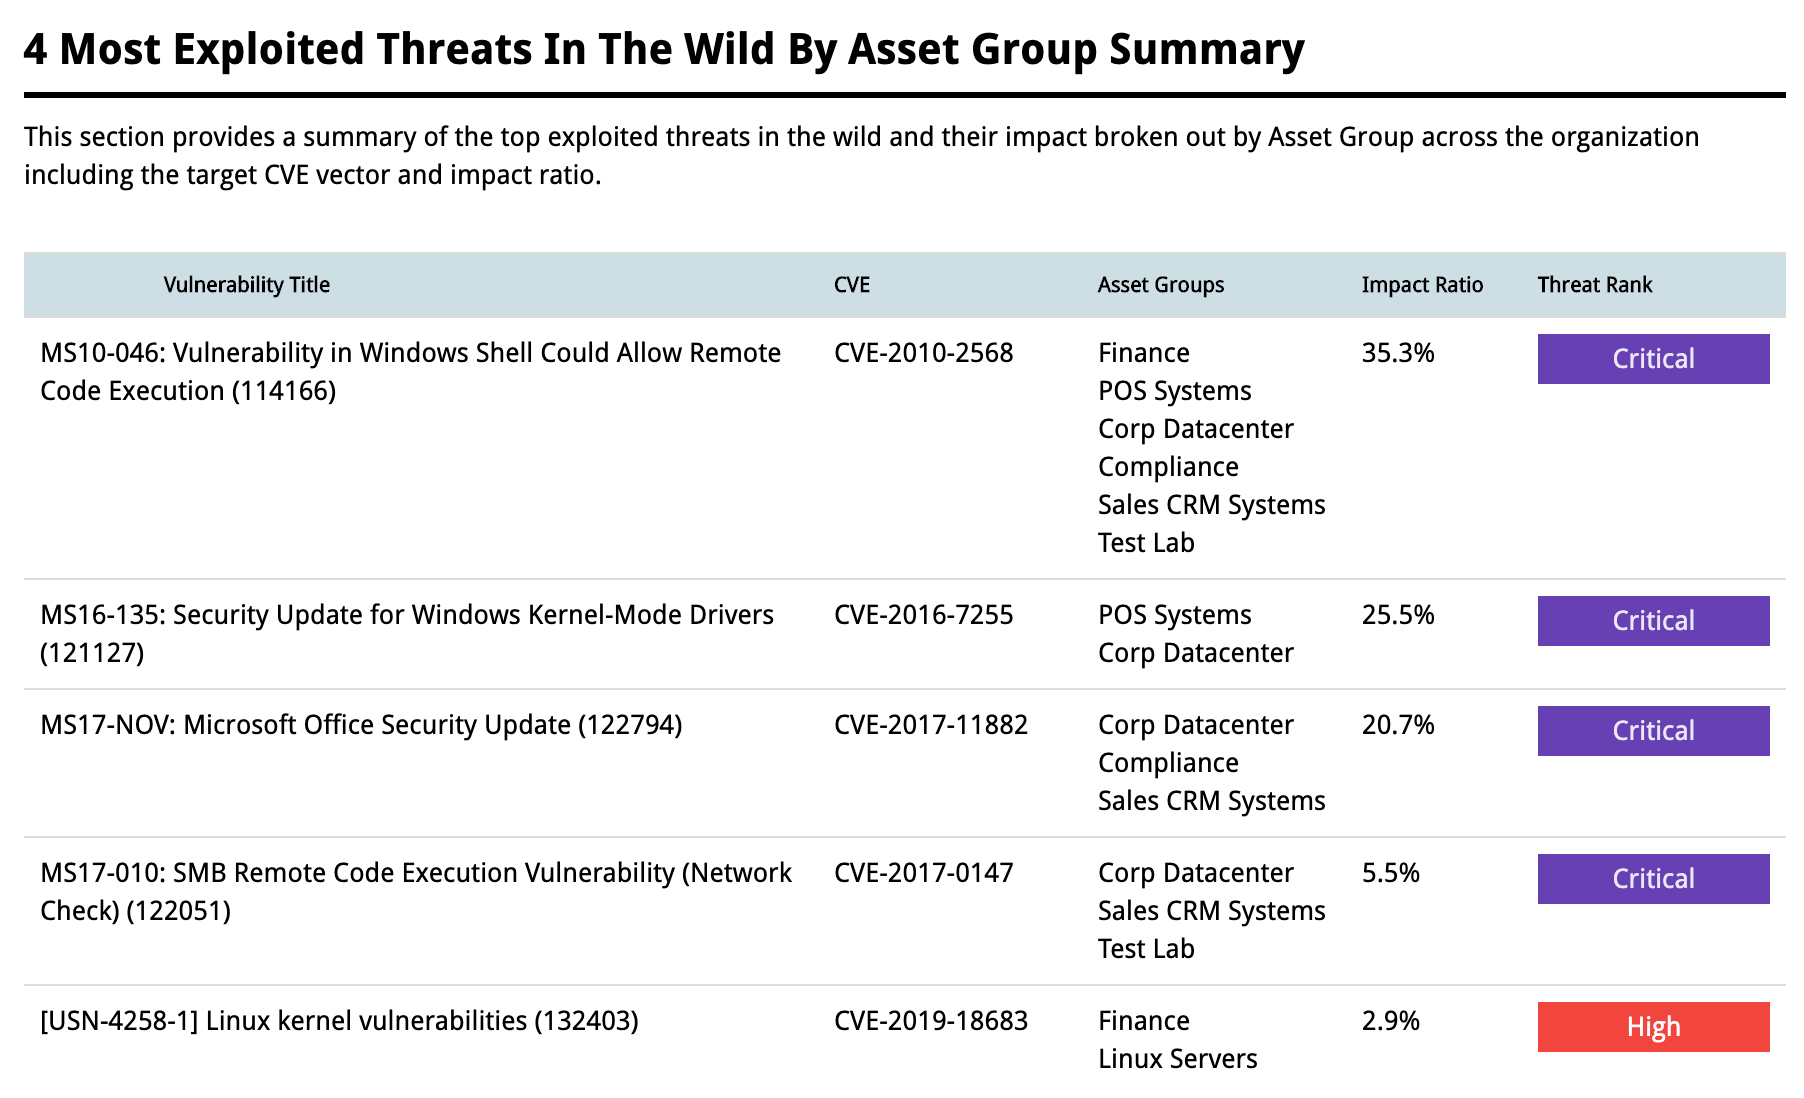
Threat Landscape allows you to properly prioritize vulnerability remediation, with the right mix of relevant data and analysis. It uses threat intelligence combined with machine learning to accurately identify those vulnerabilities that have the highest risk of exposure to proven threats (based on exploits observed in the wild rather than severity alone). By focusing your team’s efforts on vulnerabilities that carry the highest risk, your team can prioritize and remediate more effectively.
Threat Landscape uses proprietary threat intelligence models; threat intelligence feeds are aggregated and processed daily to correlate reported incidents with vulnerability exploitation. This data feeds into machine learning models that combine common vulnerability metrics such as CVSS, CWE, and CPE with vulnerability exploitation data. The result is an enriched data set to determine the likelihood of exploitability for each vulnerability, and the likelihood of weaponization of each exploit in the wild.
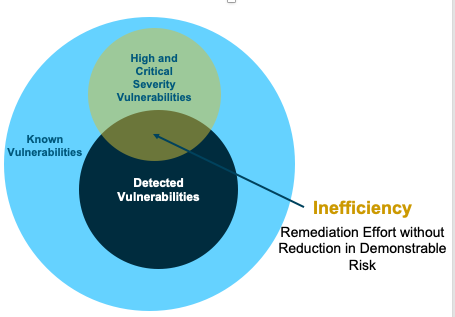
Fortra VM will help you focus remediation efforts on vulnerabilities which are weaponized, have proven exploits, or are likely to be exploited through threat intelligence features provided through Threat Landscape. You can set personalized risk thresholds according to your organizations priorities.
Threat Rank
Threat Intelligence has become a vital part of security products including Vulnerability Management. Now you can leverage threat intelligence to classify which vulnerabilities are most likely to be exploited to prioritize your remediation efforts to the vulnerabilities that create the largest amount of risk for your organization, instead of attempting to patch all of them regardless of how likely they are to be exploited in an attack.
Threat Rank is a score, on a 0-100 scale, assigned to a vulnerability to rank it on its likelihood of exploitation in the wild. The purpose is to identify how likely the vulnerability is to be targeted if a malicious actor targets your organization OR how likely is an exploit for the vulnerability to be included in untargeted attack campaigns such as adware or phishing/whaling. This score ranks the possibility of exploitation inside your network by identifying upcoming attack vectors yet to be realized in the wild. You can stay ahead of attacker-weaponized vulnerabilities by resolving those most likely to be exploited with aggregated threat intelligence using these models with daily Threat Rank updates within Fortra VM.
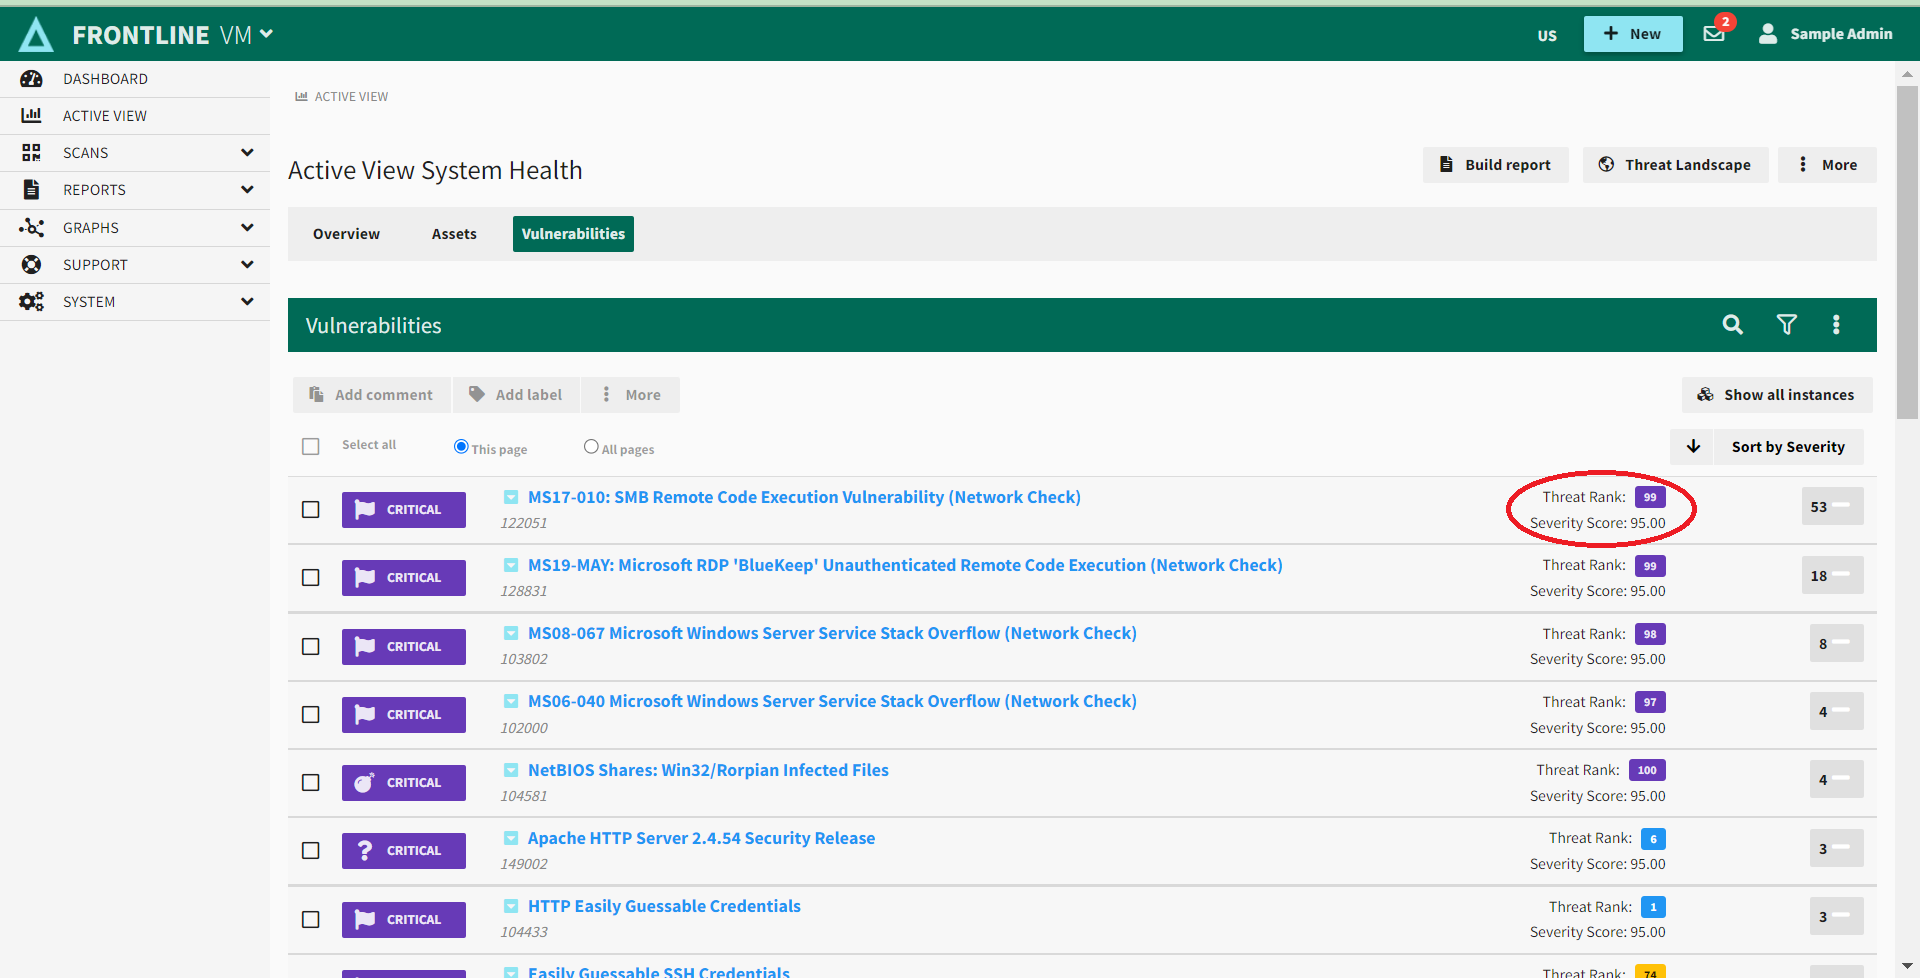
Threat Rank scores are visible to all clients with a Fortra VM scanning service including, Fortra Vulnerability Management and Active Threat Sweep. This feature reveals enhanced threat indicators to describe the correlation, volume, and recentness. The Threat Rank identifier can be utilized through filters, sorting orders, graphs, tables, notifications, and reports within Fortra VM, one-for-one to their Severity Rating counterparts.
Active Risk
Active Risk uses system or configurable risk profiles combining vulnerability severity, Threat Rank, asset exposure, and asset criticality to create and rate your organization’s risk appetite. Empower your security operations center to analyze and report on trends and metrics for every asset and vulnerability in your Threat Landscape, and demonstrate targeted, measurable progress in securing your environment.
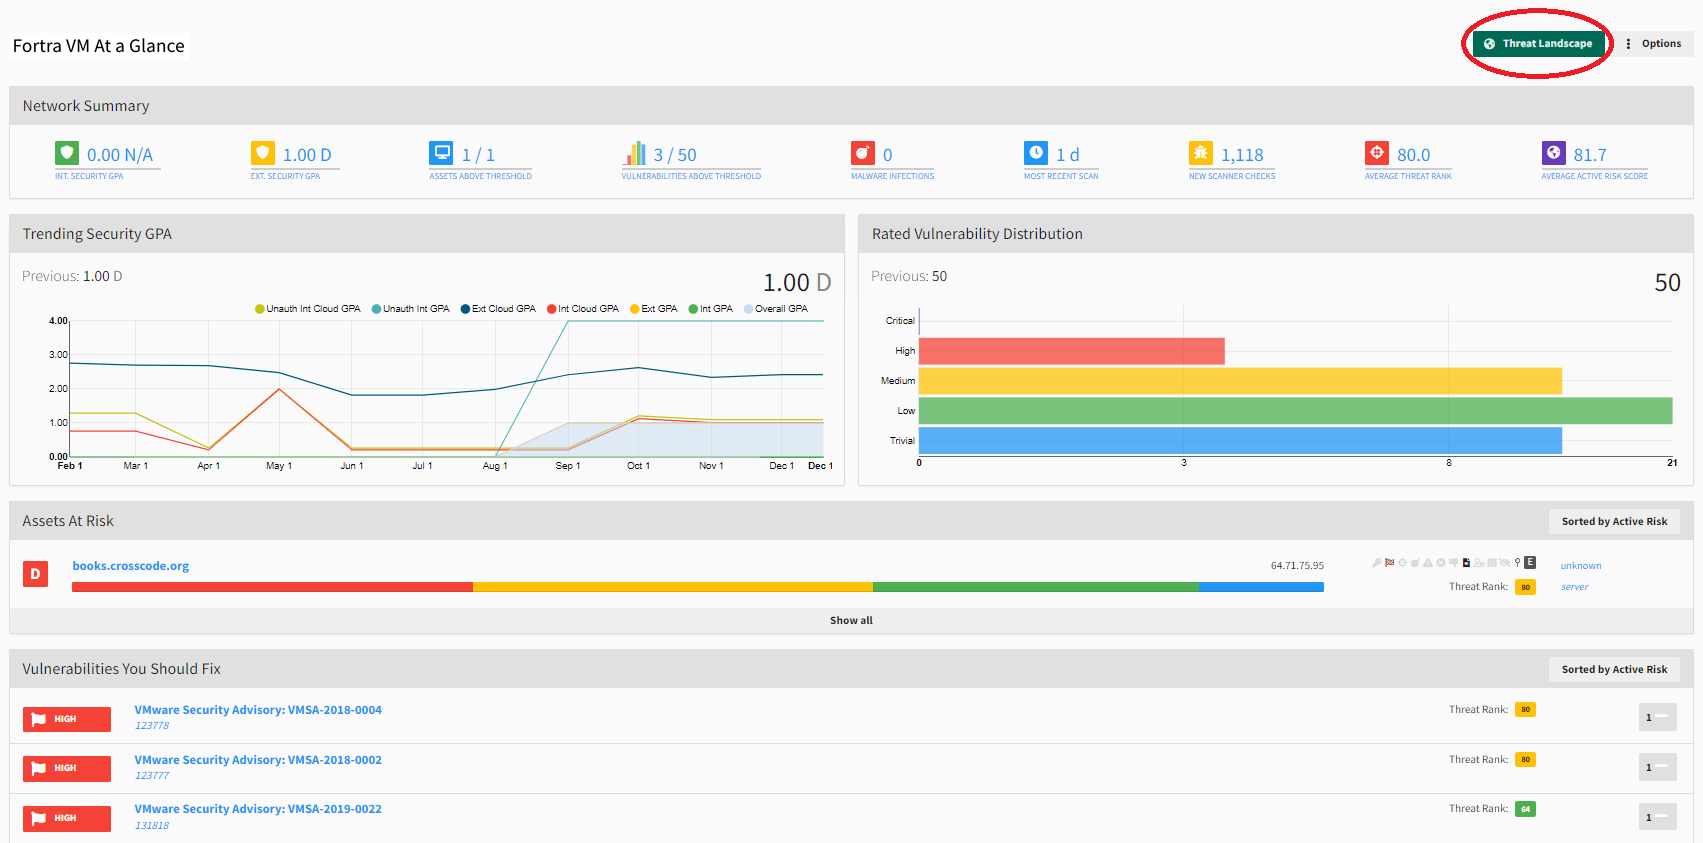
Use the Threat Landscape button on the Dashboard, in Active View, and in Scan Results to view your security posture by way of Threat Rank.
Engaging this Threat Landscape toggle changes the displayed data from the classic Rating and Severity (inclusive of Critical, High, Medium, Low, Trivial and Info) to Threat Rank focused data sets.
Active Risk provides:
- Configurable risk profiles to define risk thresholds unique to your organization’s needs
- Functionality to unify risk vectors to generate multidimensional risk exposure
- Suite of related graphs, reports and filters
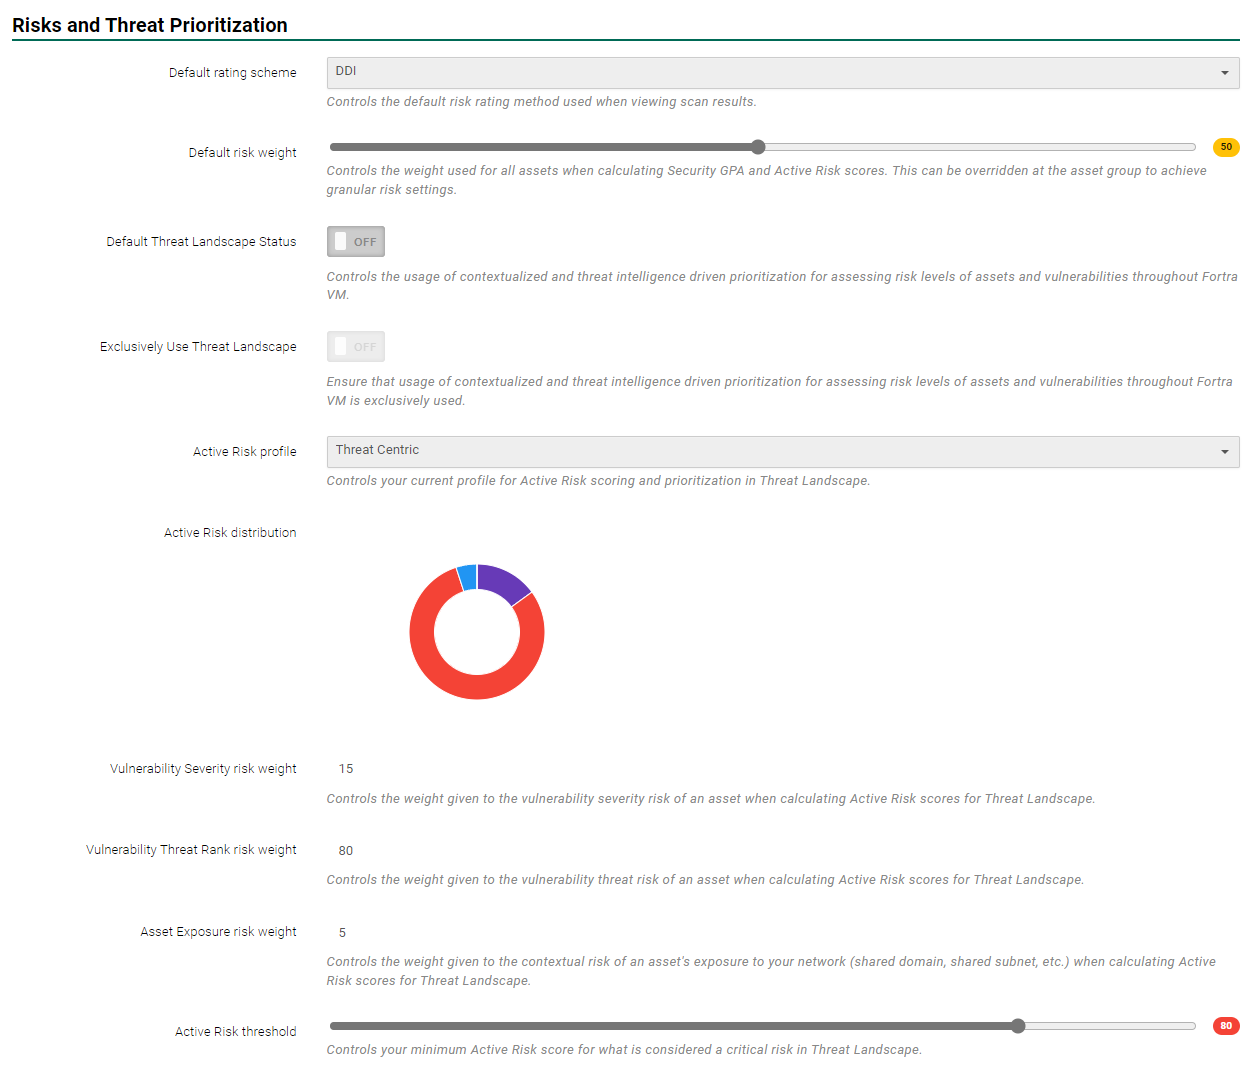
The Active Risk threshold is also found under Scan Settings > Settings > Risks and Threat Prioritization.
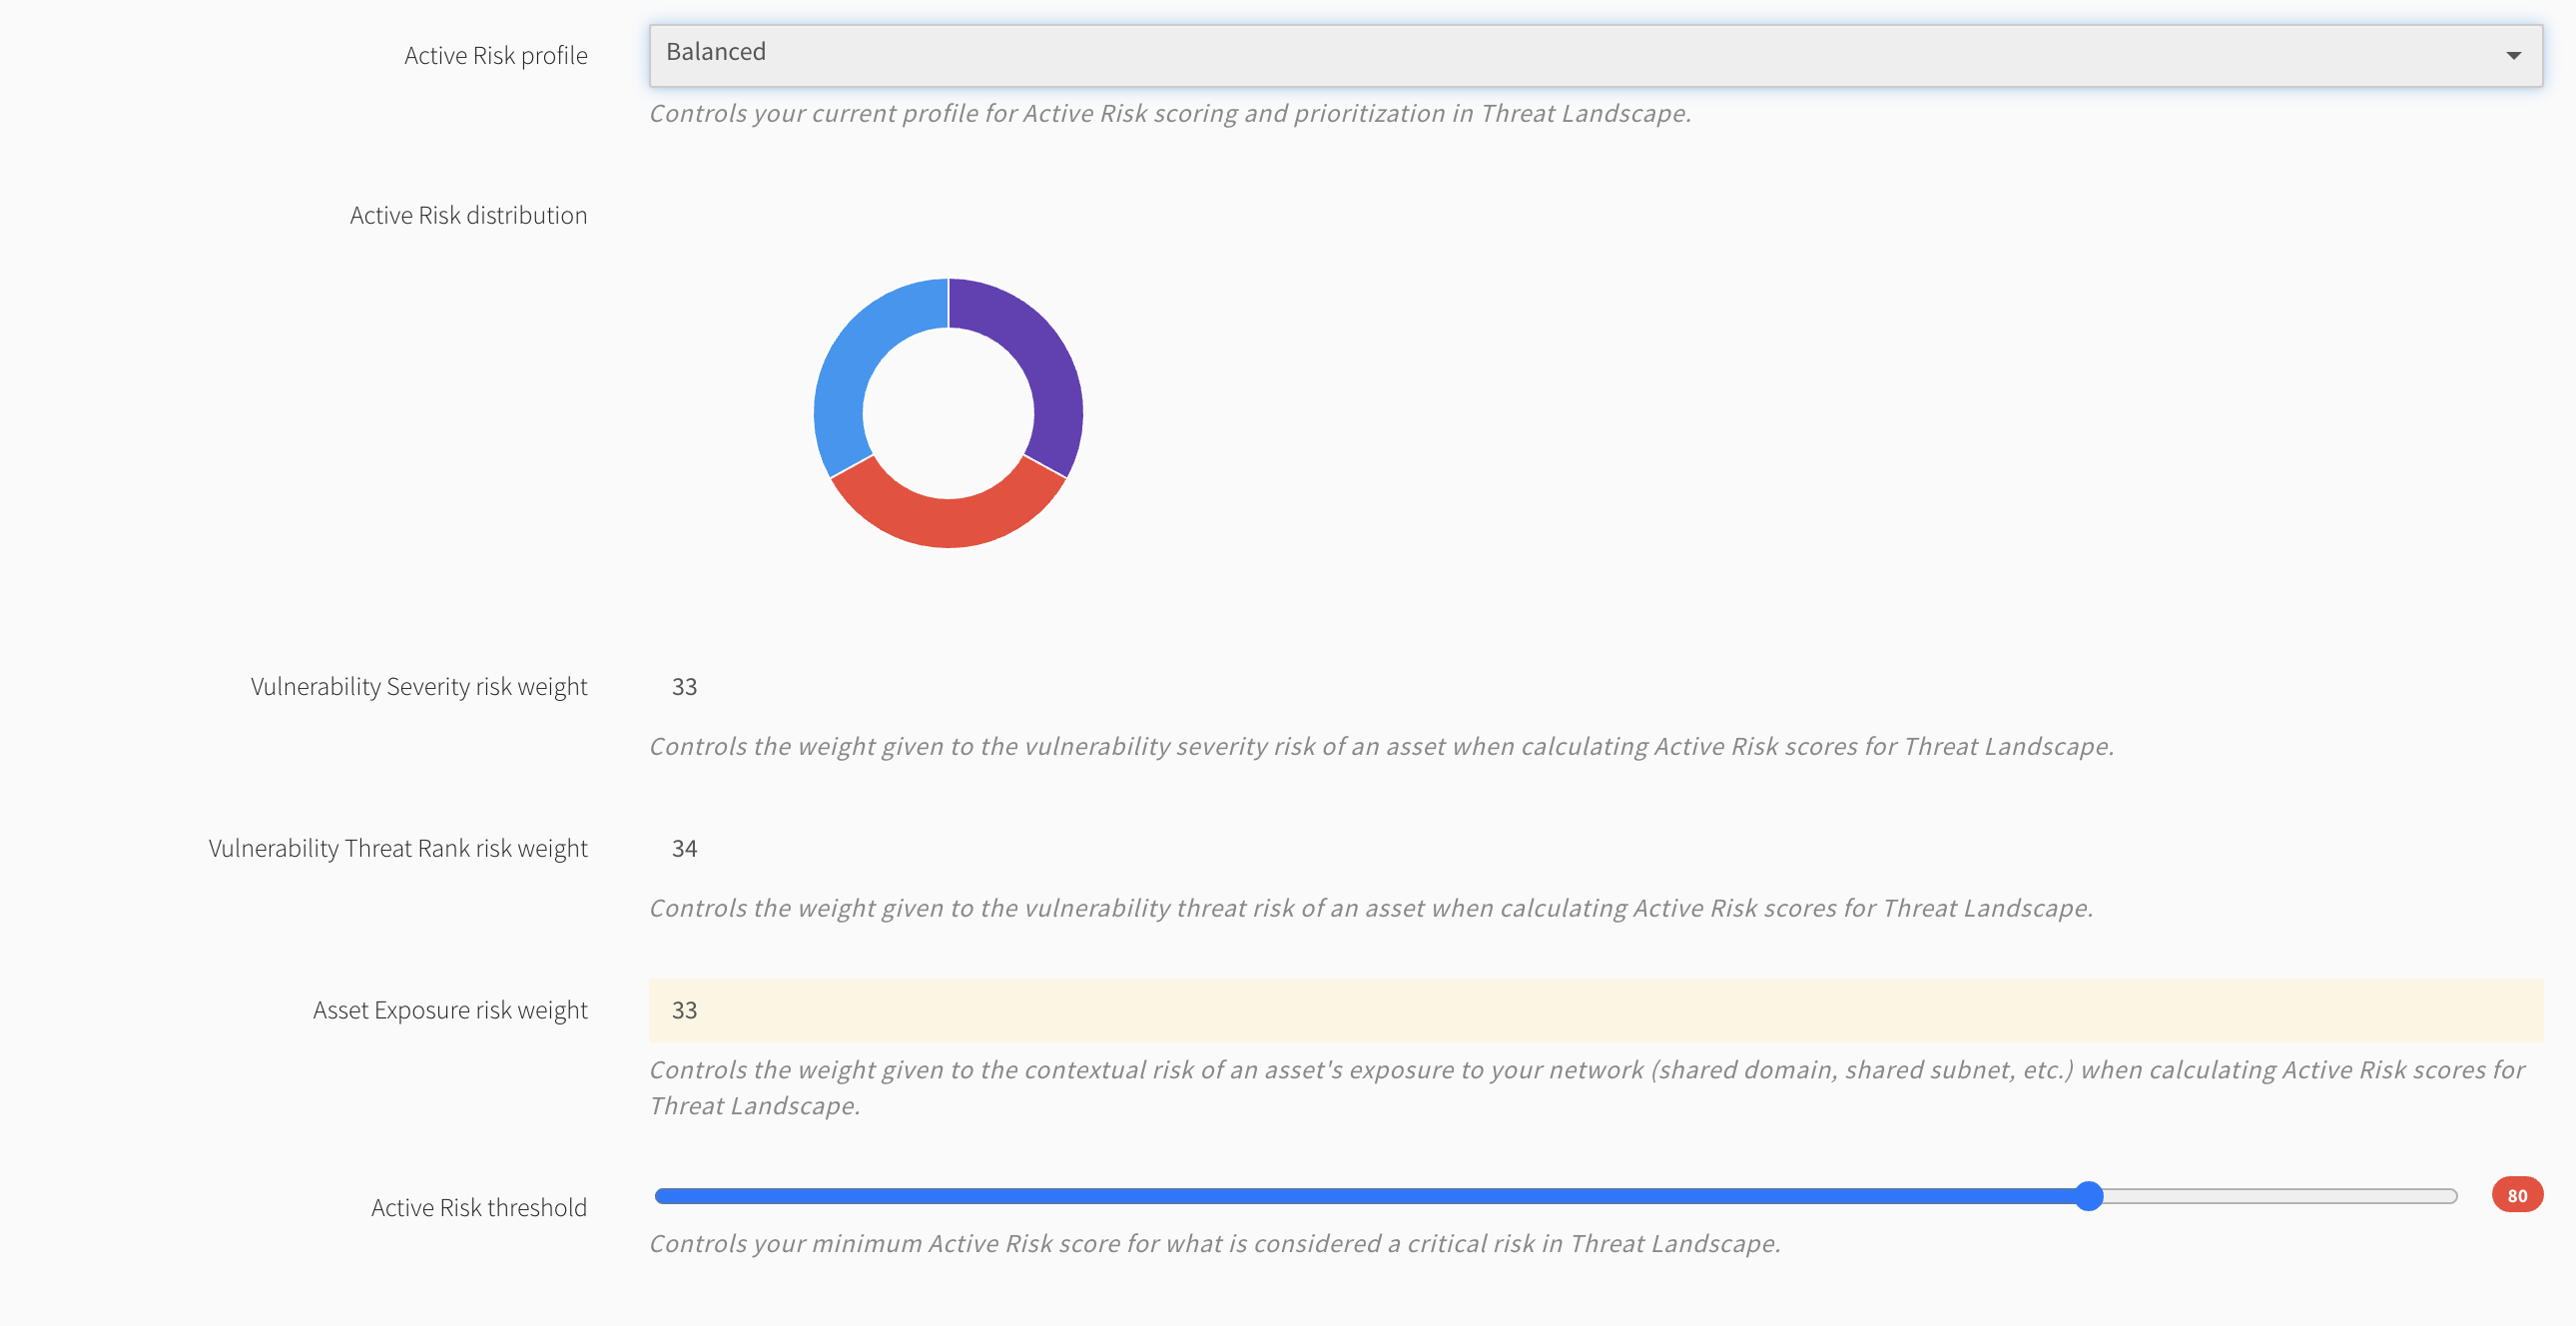
- Active Risk Threshold is a scale you define to determine when an asset becomes a threat requiring attention. It can be set to focus on those items which fall outside a desired limit value. The default is set to 80.
- This ability to set a custom threshold for each account allows you to establish a remediation prioritization ecosystem that matches your organization’s remediation capacity to focus on what matters most. You now have the ability to determine your own risk tolerance and posture. What this does is eliminate the common occurrence of being overwhelmed by a sea of theoretically high severity vulnerabilities that might not actually affect your organization.
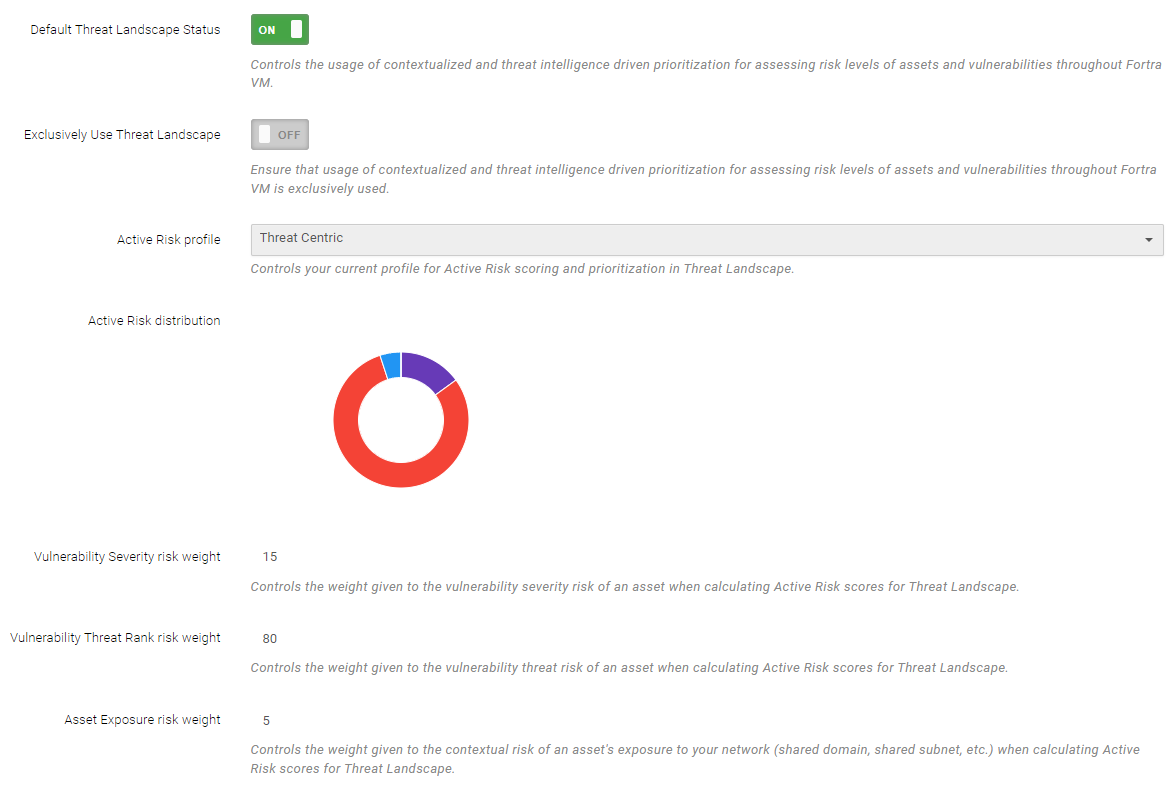
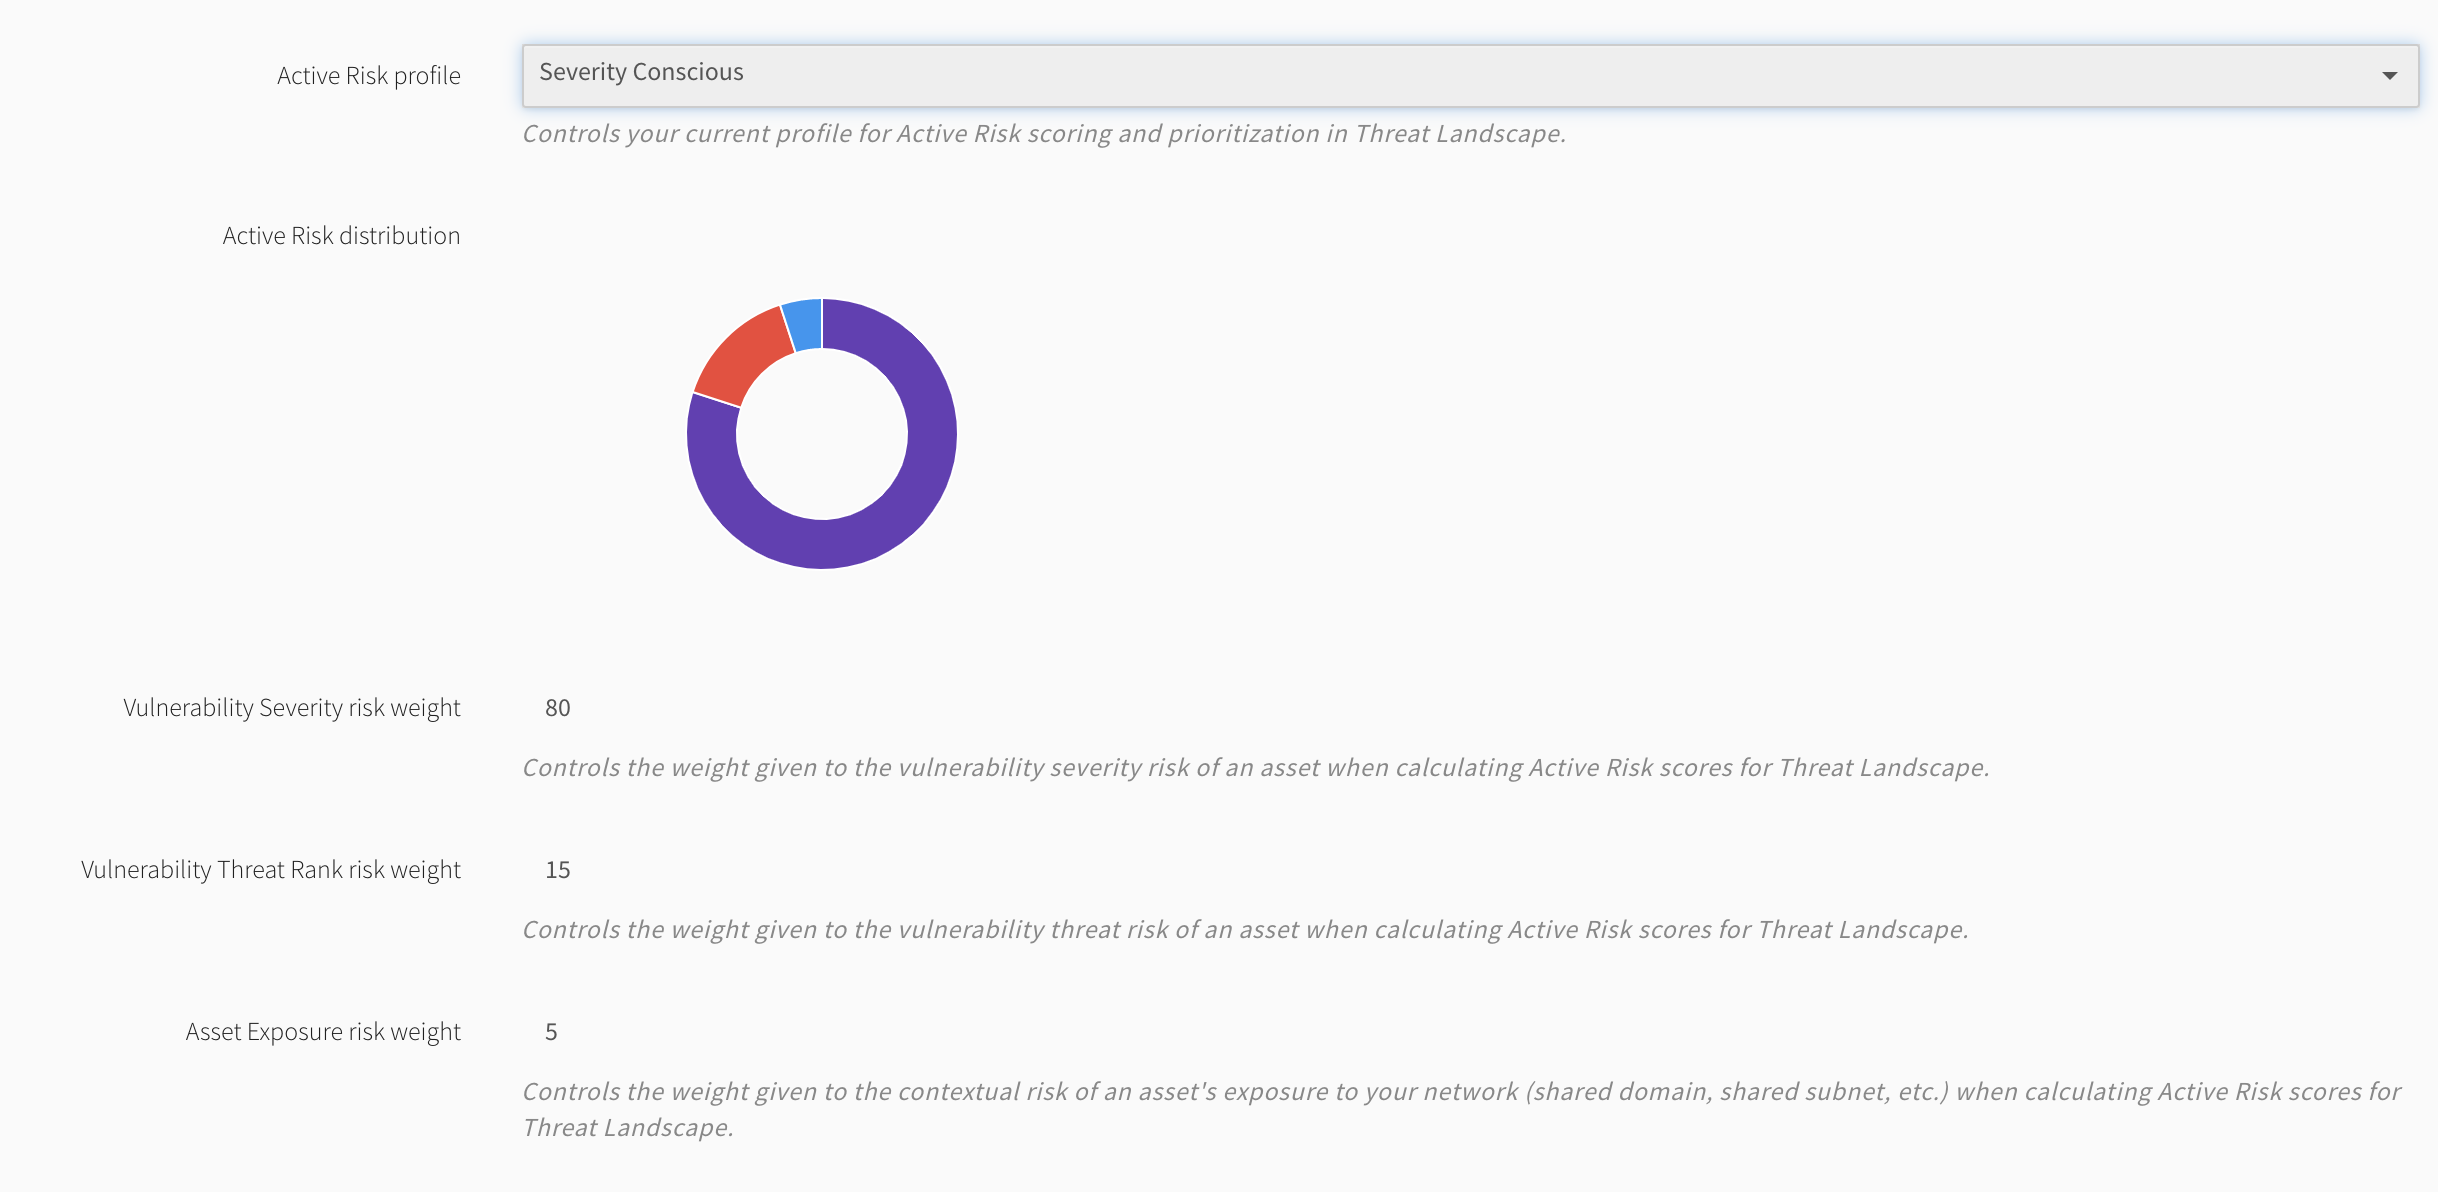
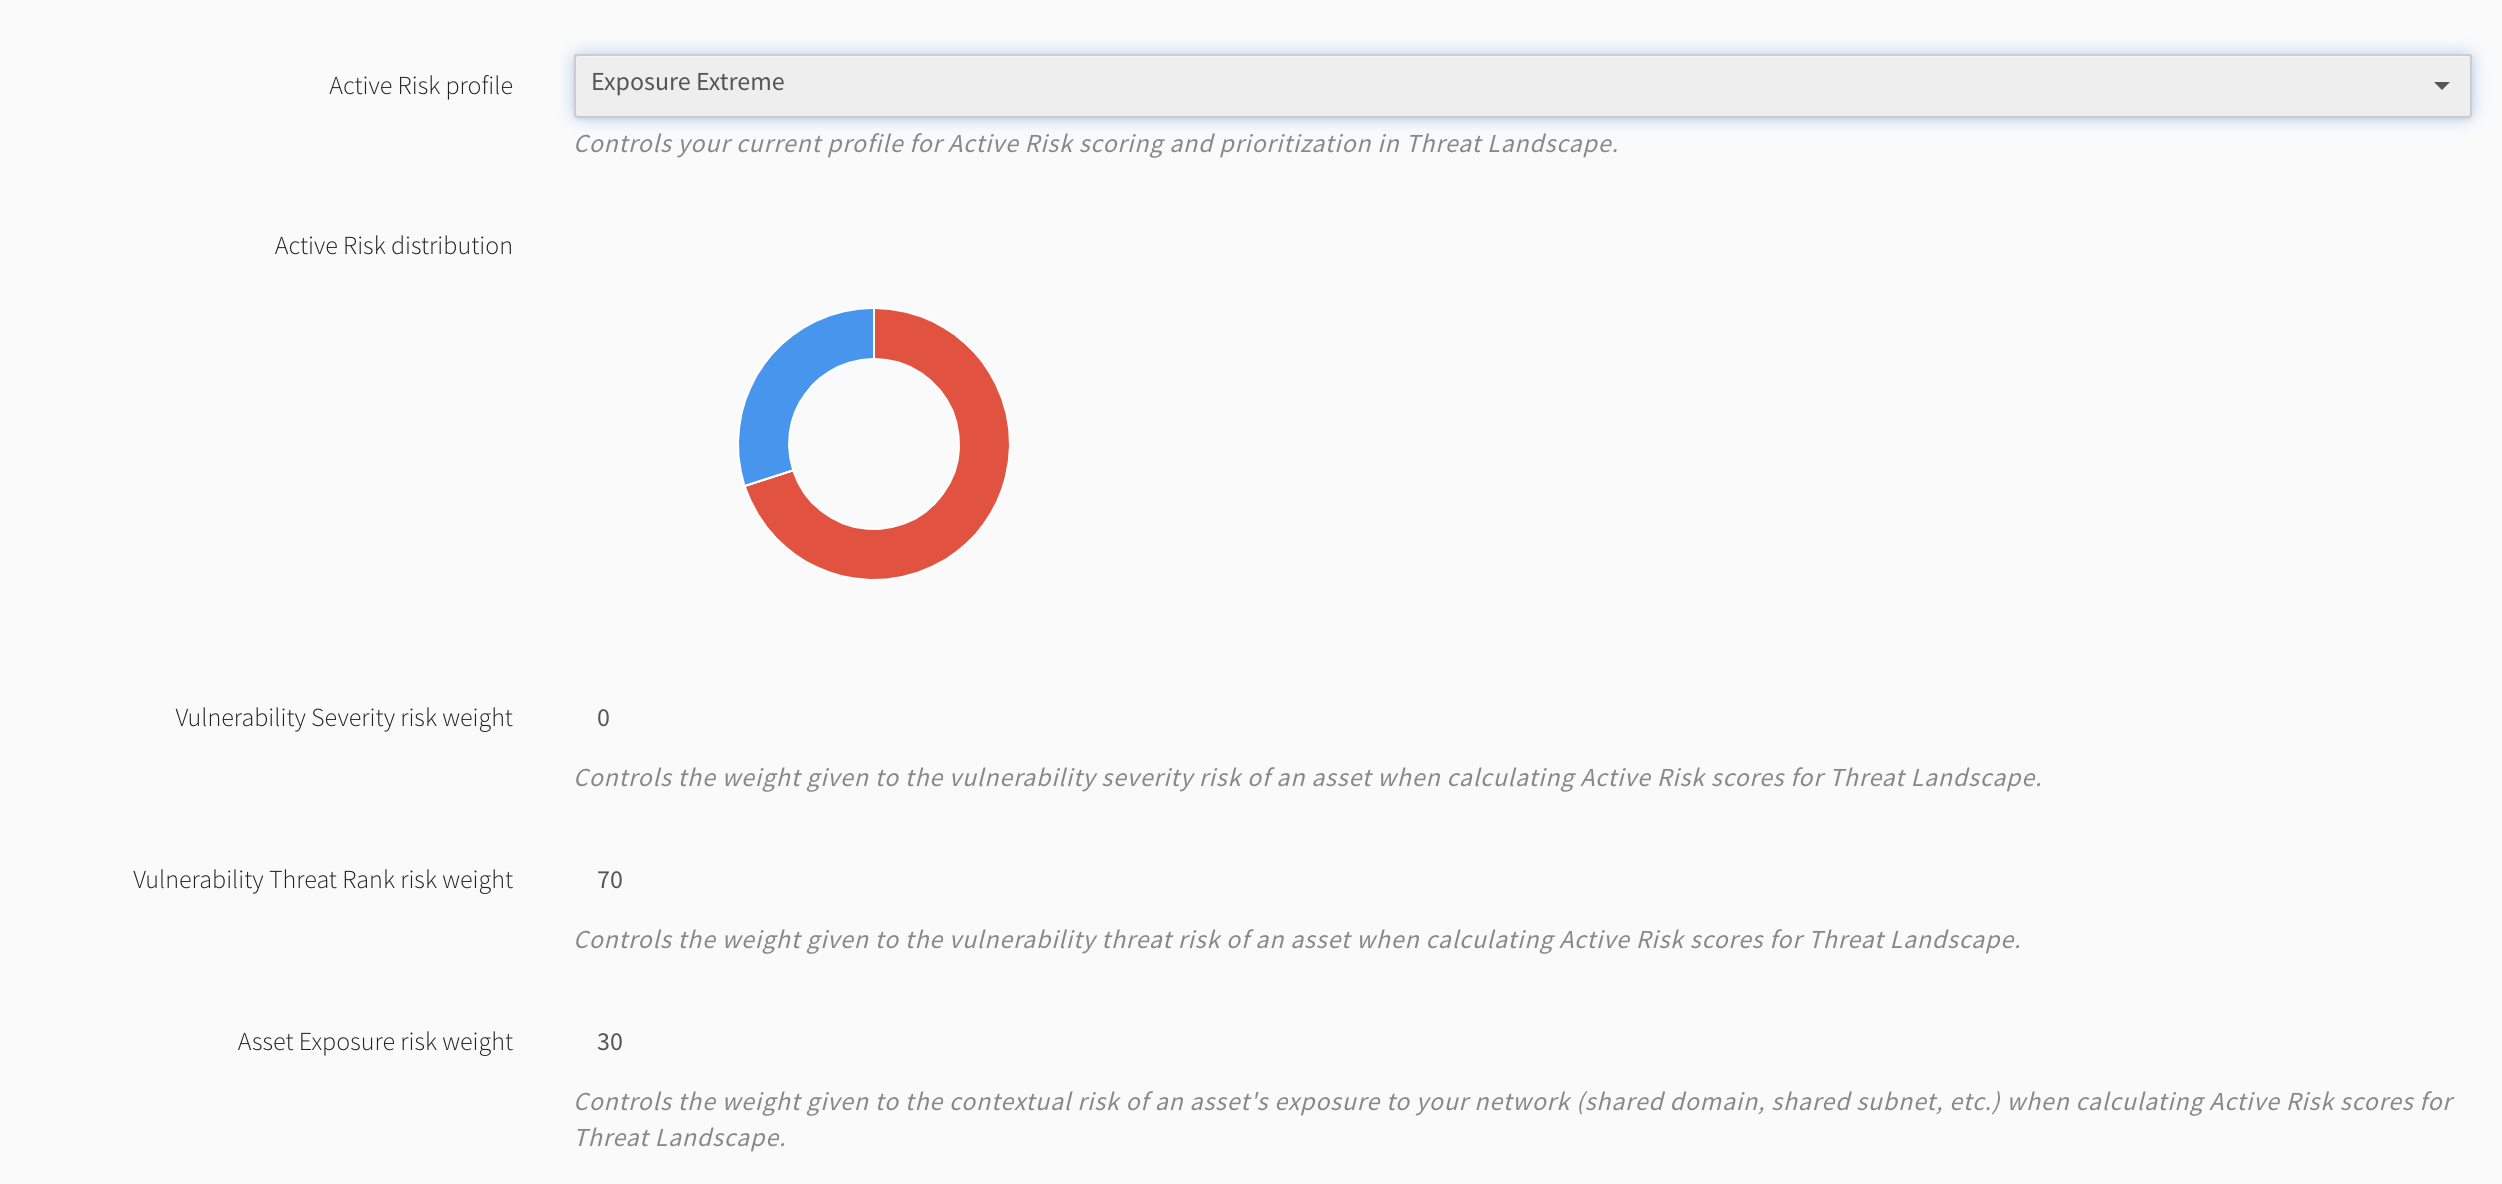
You can configure an Active Risk profile unique to your organization’s risk posture. When Threat Landscape mode is active, Fortra VM dynamically reevaluates all of the account’s assets and vulnerabilities through the weight distribution defined in the account’s Active Risk profile.
Threat Landscape also provides system defined Active Risk Profiles to include a severity-based profile which models the current Fortra VM paradigm to allow for a seamless transition into the added subscription features.
Predefined Risk Profiles
-
Threat Centric - high weighted threat ranking
-
Severity Conscious - high weighted vulnerability severity
-
Exposure Extreme - high weighted exposure risk
-
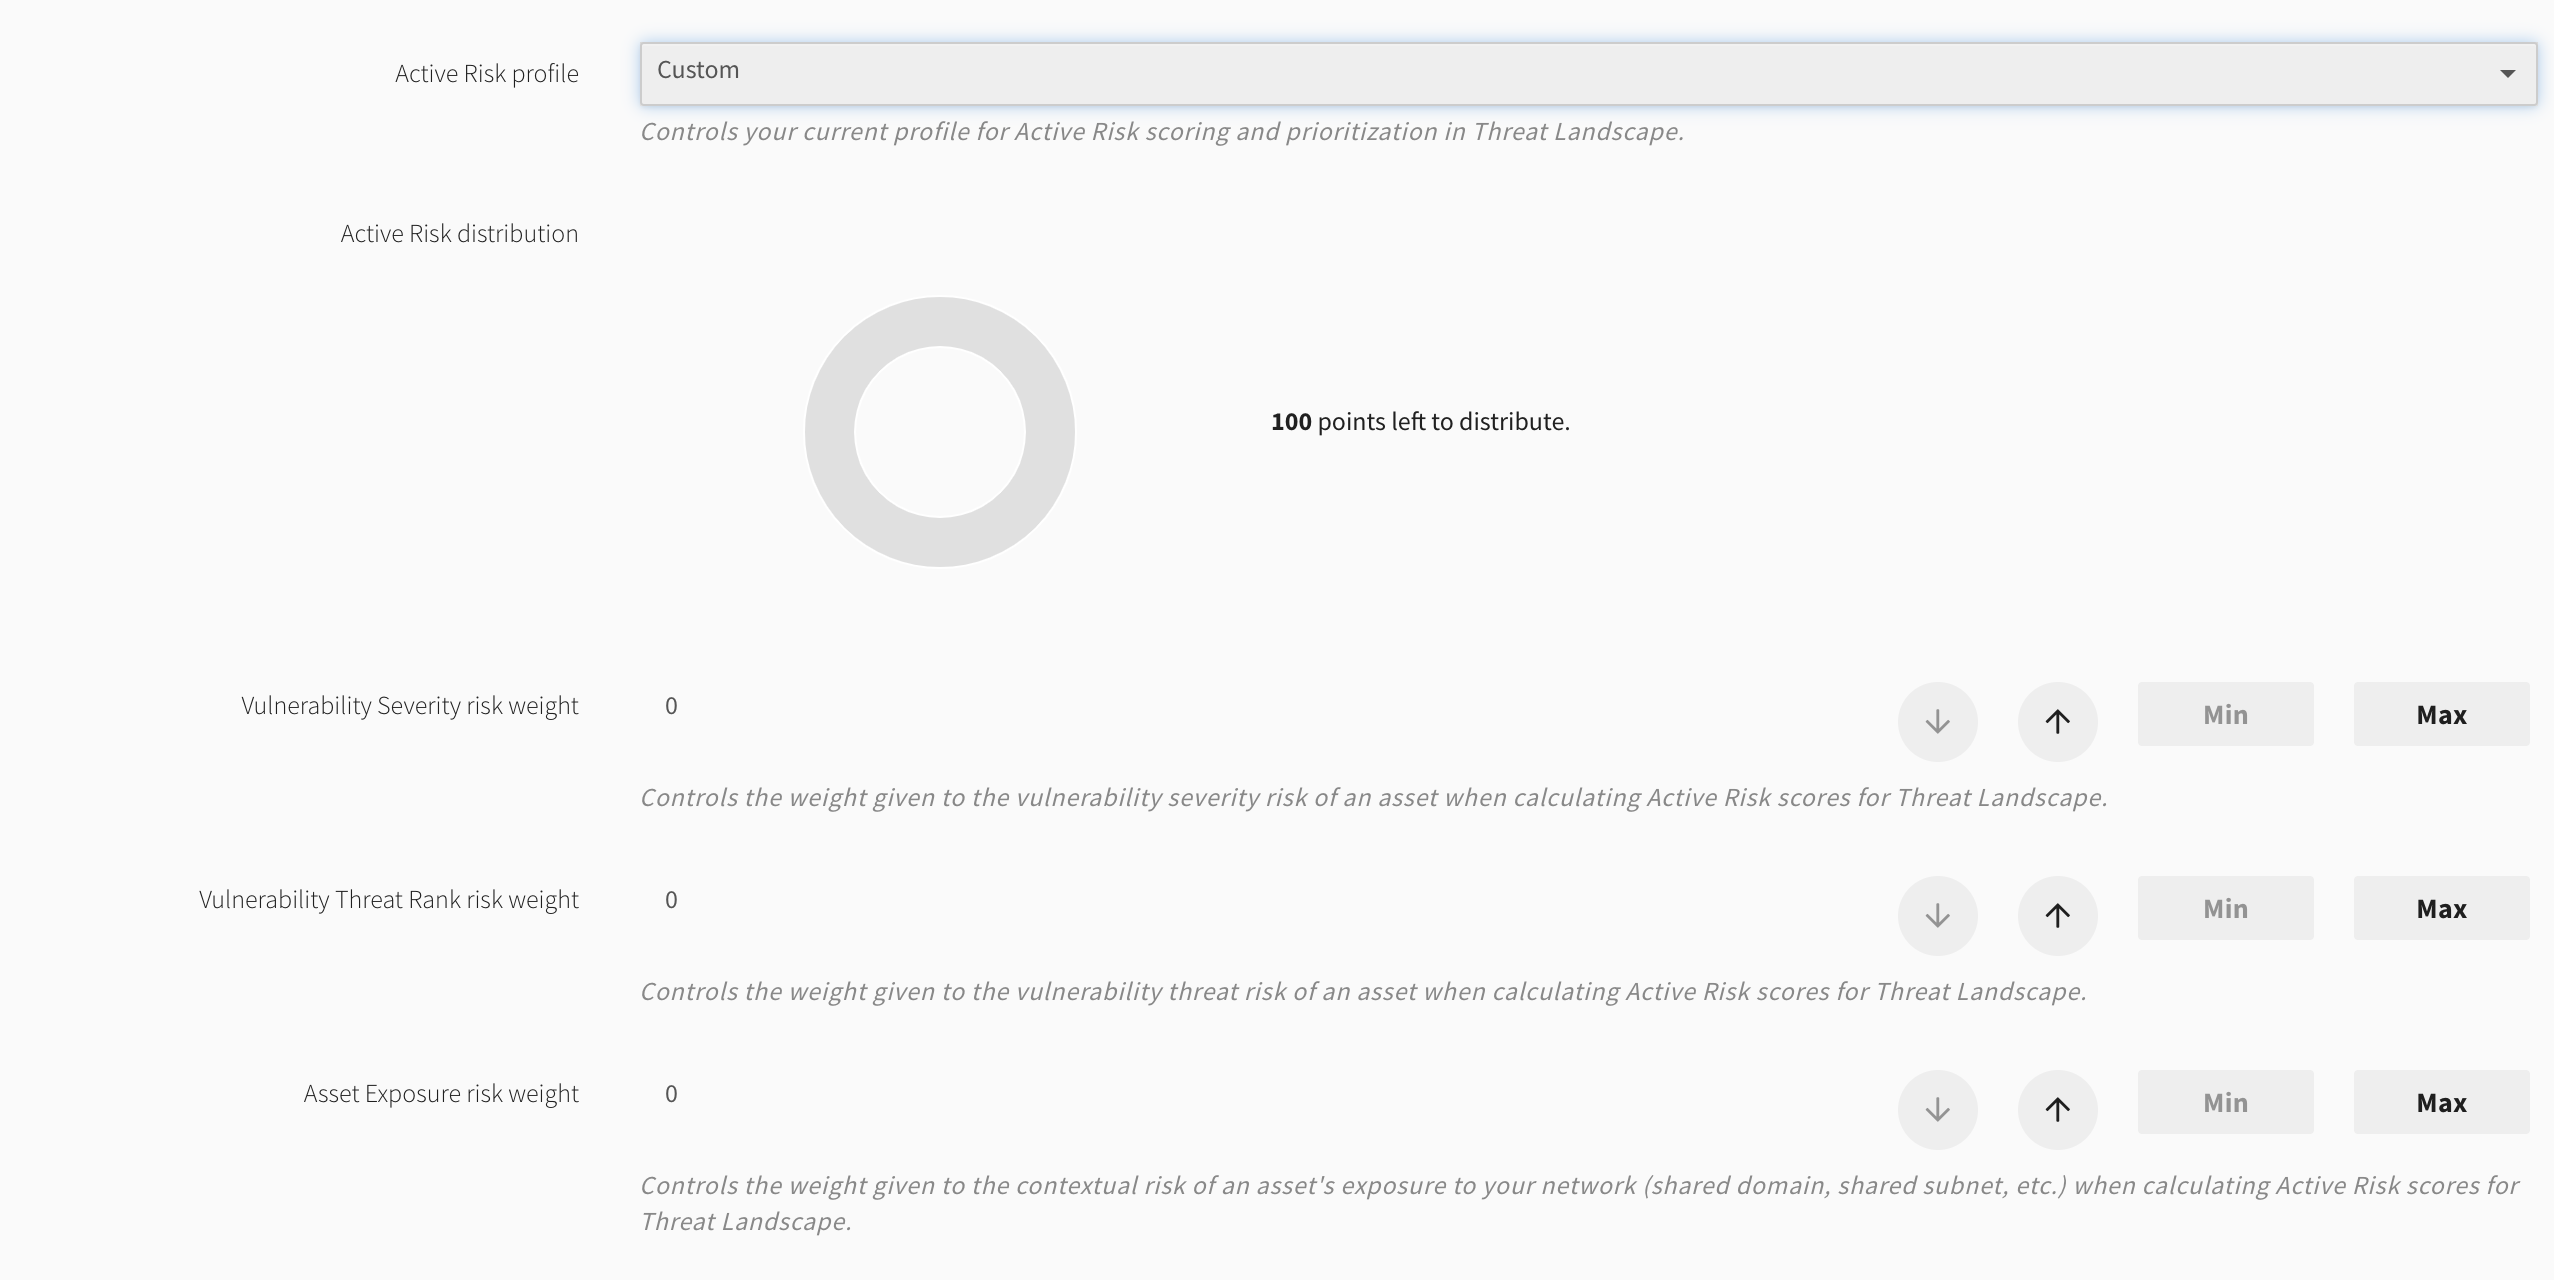
Custom - administrator defined weights of each of the following vectors to equal a sum of 100
-
Balanced - even weight between threat, severity, and exposure risk
Threat Landscape allows you to go deeper than just quantification when it comes to risk assessment. Your Active Risk Score (ARS) is supplemented with a risk breakdown to describe your risk exposure through the lens of your Active Risk profile and justify it through the context of the account’s scanned network.
Active Risk Scores rate assets and vulnerabilities based on client-selected risk profiles to define actual risk exposure.
See the table of Active Risk Vectors below to understand what data composes this score calculation.
Active Risk Vectors
| Vector | Scale |
|---|---|
| Vulnerability Threat Rank | 0 - 100 points |
| Asset Active Risk Score is calculated based on the single highest Threat Rank from the vulnerabilities on that asset | |
| Vulnerability Severity | 0 - 100 points |
| Asset Active Risk Score is calculated based on the cumulative Severity Score from all vulnerabilities on that asset | |
| Asset Exposure Risk | 0 - 100 points |
| Vulnerability Active Risk Score is calculated based on the Exposure Score calculated for the asset that the vulnerability is found on | |
| Asset Exposure Score= 0.4*(Asset Risk Weight: 0-100) + 0.3*(Highest Threat Rank from assets on the same Host Domain: 0-100) + 0.2*(Highest Threat Rank from assets on the same Host Subnet: 0-100) + 10(If the asset is external) | |
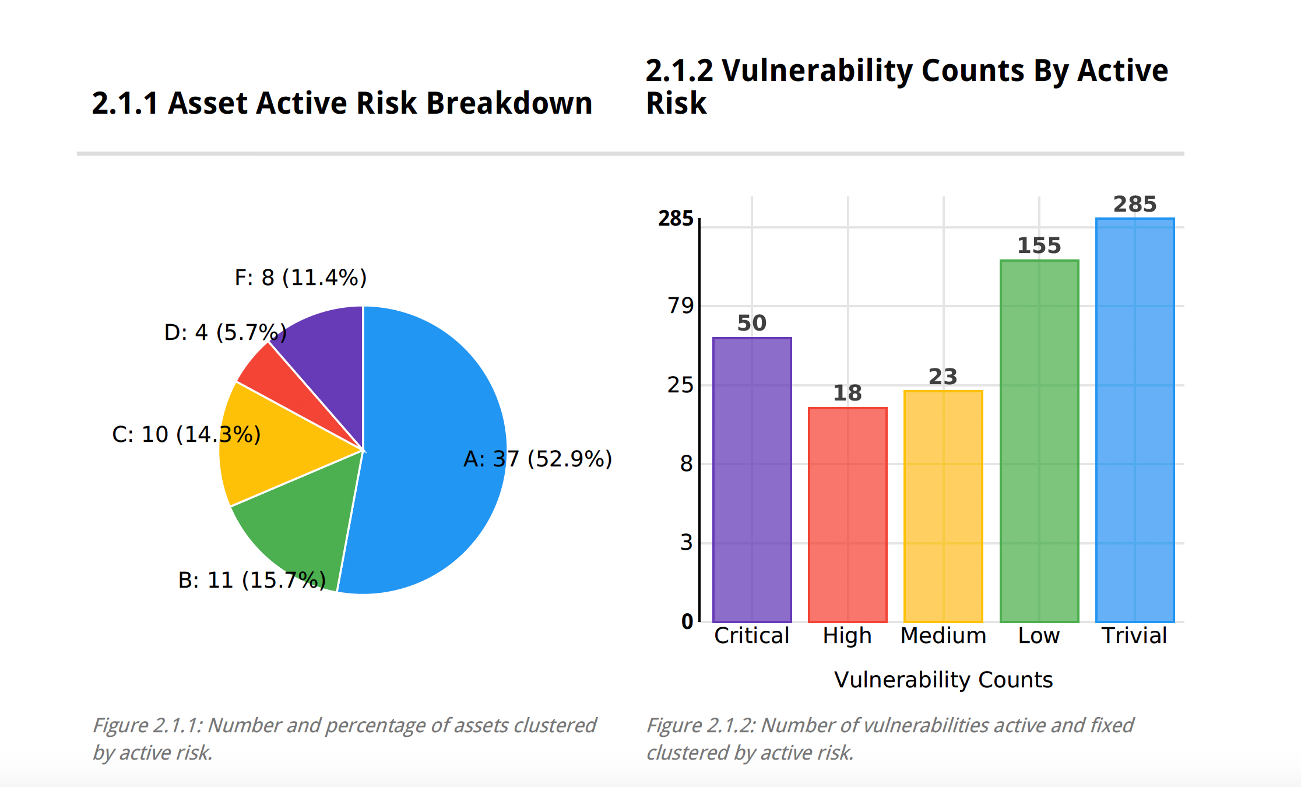
When the Threat Landscape view is engaged within the Dashboard, Active View, and Scan Results; the Active Risk Score (ARS) is displayed as the asset and vulnerability rating shown in a numeric value ranging from 1-100, represented as F, D, C, B, or A for assets.
For vulnerabilities the ARS is shown as Critical, High, Medium, Low, and Trivial.
The ARS leverages the Active Risk Threshold to group Asset and Vulnerabilities into a minimal rating scheme of being either "Above the Fold" (indicating a rating above the set threshold) or "Below the Fold" (indicating a rating below the set threshold).
All vulnerabilities above this threshold will be flagged and differentiated in Threat Landscape features including the Dashboard, Active View, and Reports to provide attainable and focused remediation for your organization.
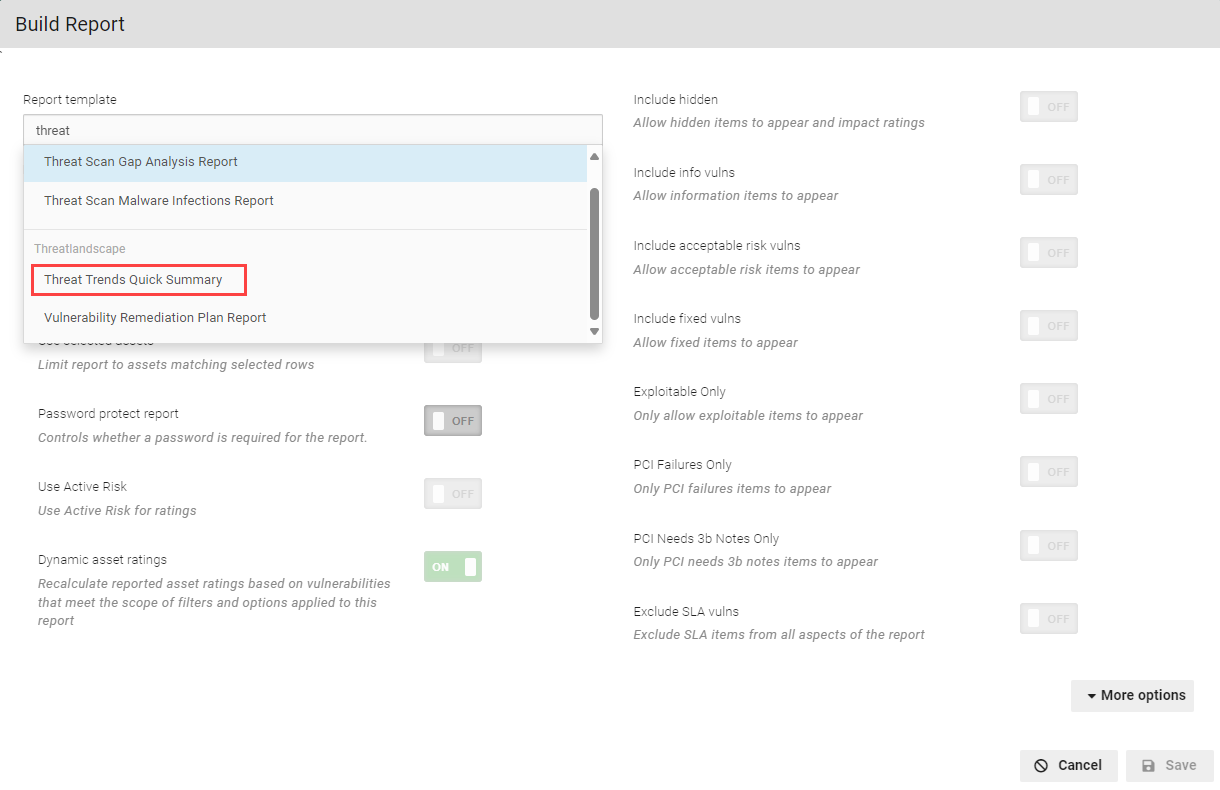
There are two new report templates specific to Threat Landscape:
Threat Trends Quick Summary
This captures the Threat Landscape in the context of your scanned network.
To build this report, select Build Report under Active View or under Scan Activity.
To view the report, select History, and download the correct report. The report opens in a PDF and provides a breakdown of data.
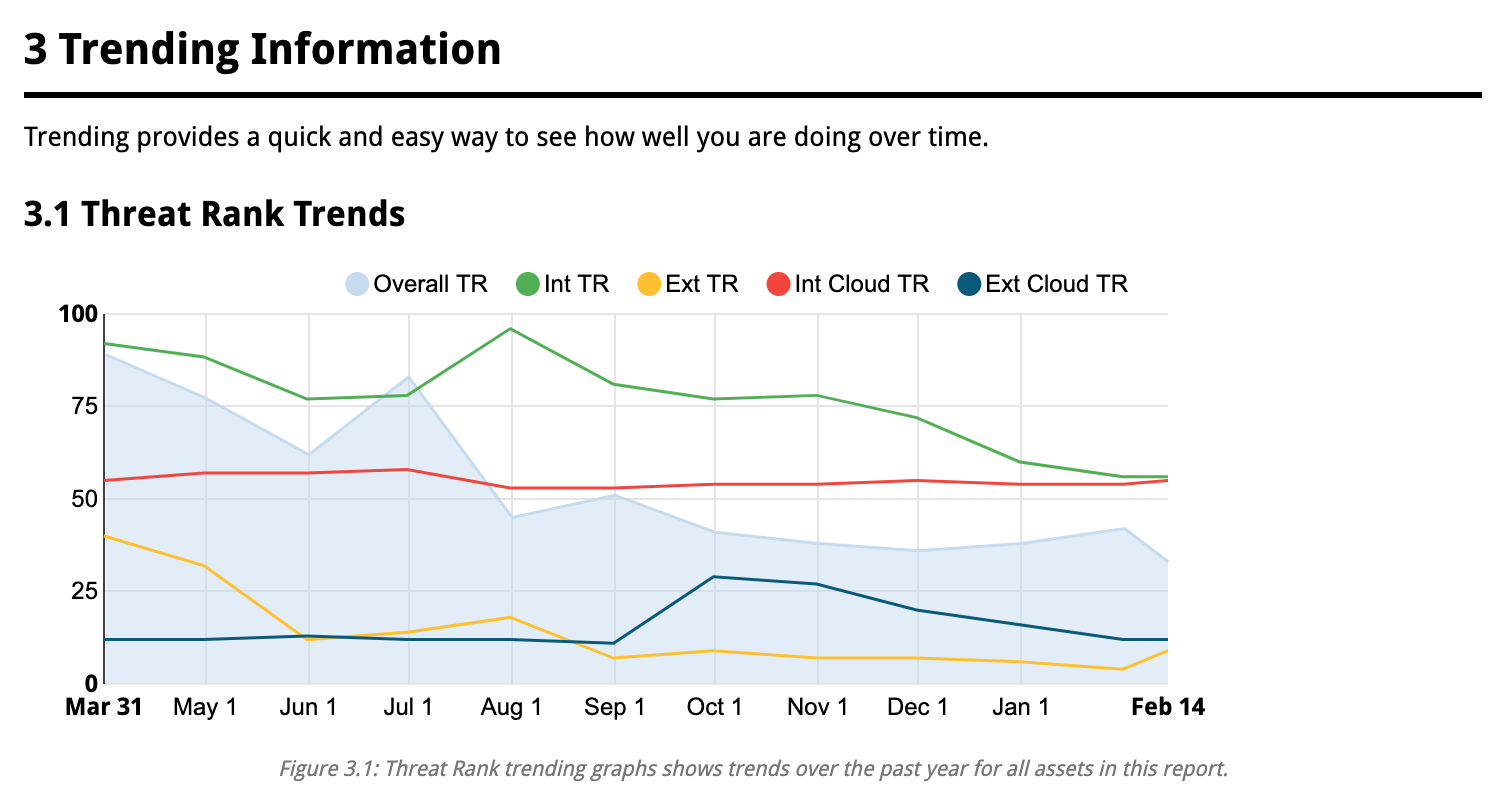
A variety of breakdowns are available - such as Trending Information.
You can see a breakdown of vulnerabilities.
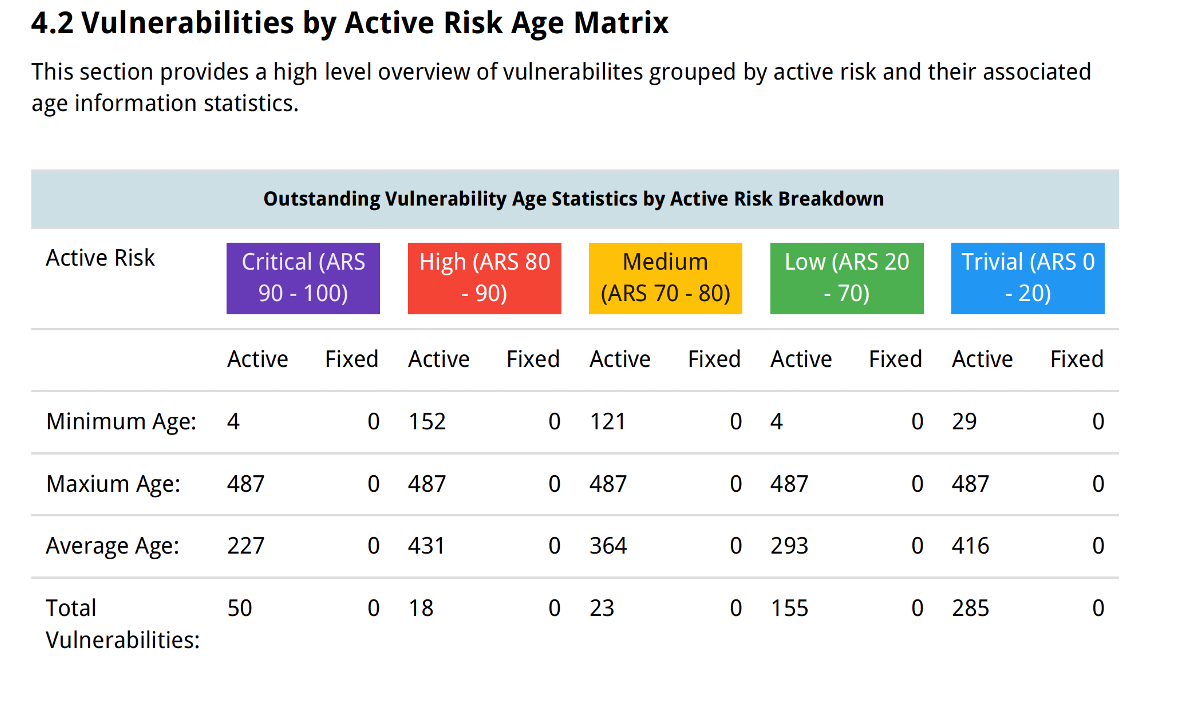
You can view Risk Age Matrix.
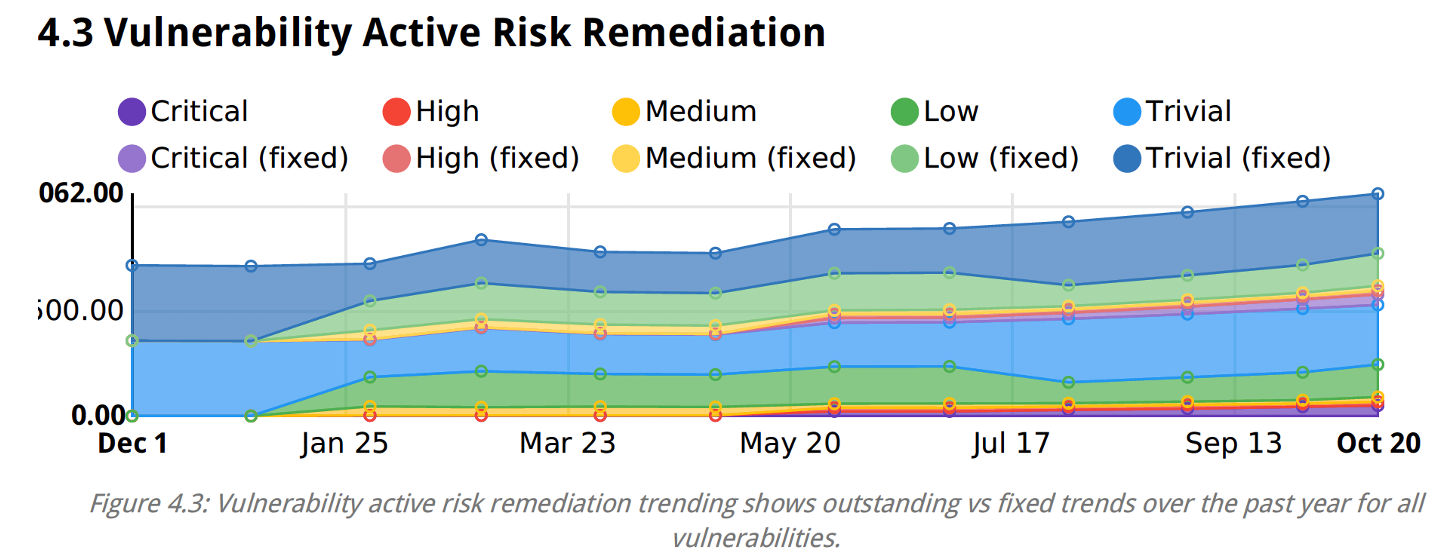
You can see threat trends like Risk Remediation.
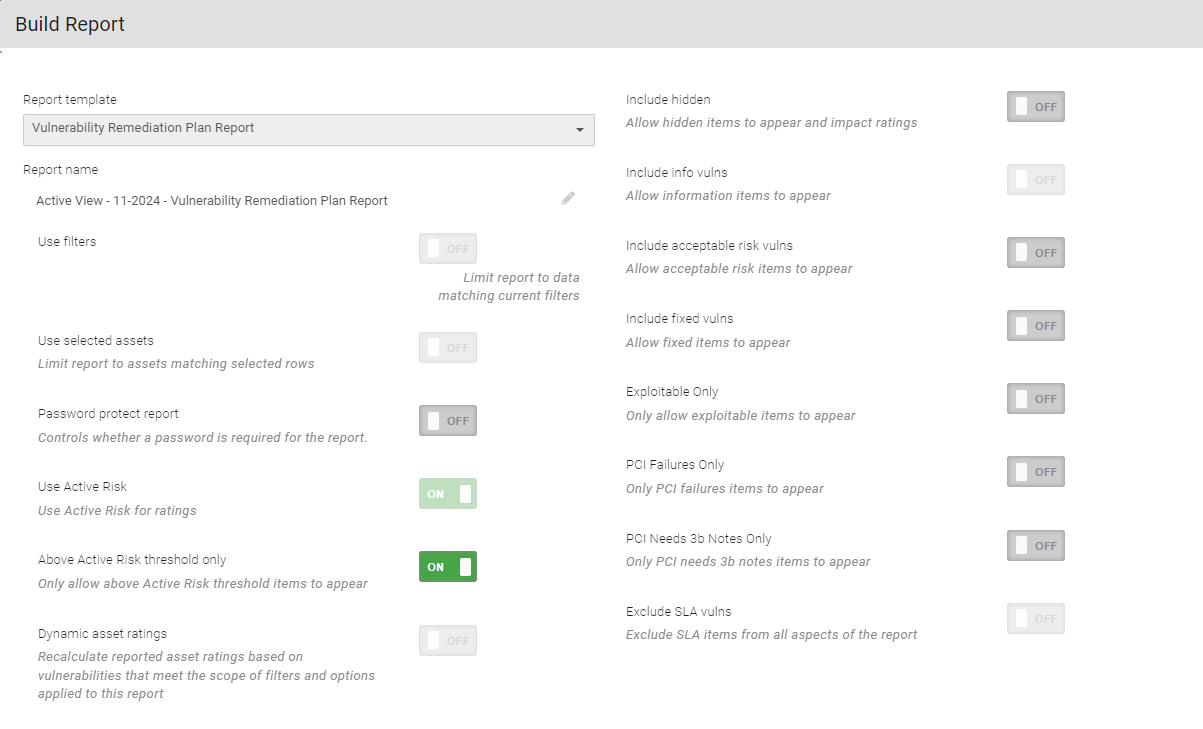
Vulnerability Remediation Plan Report
This provides a digested outline of what to focus on immediately to reduce the greatest Active Risk exposure to the internal and external network.
To build the report, select Build report under Active View or Scan Activity.
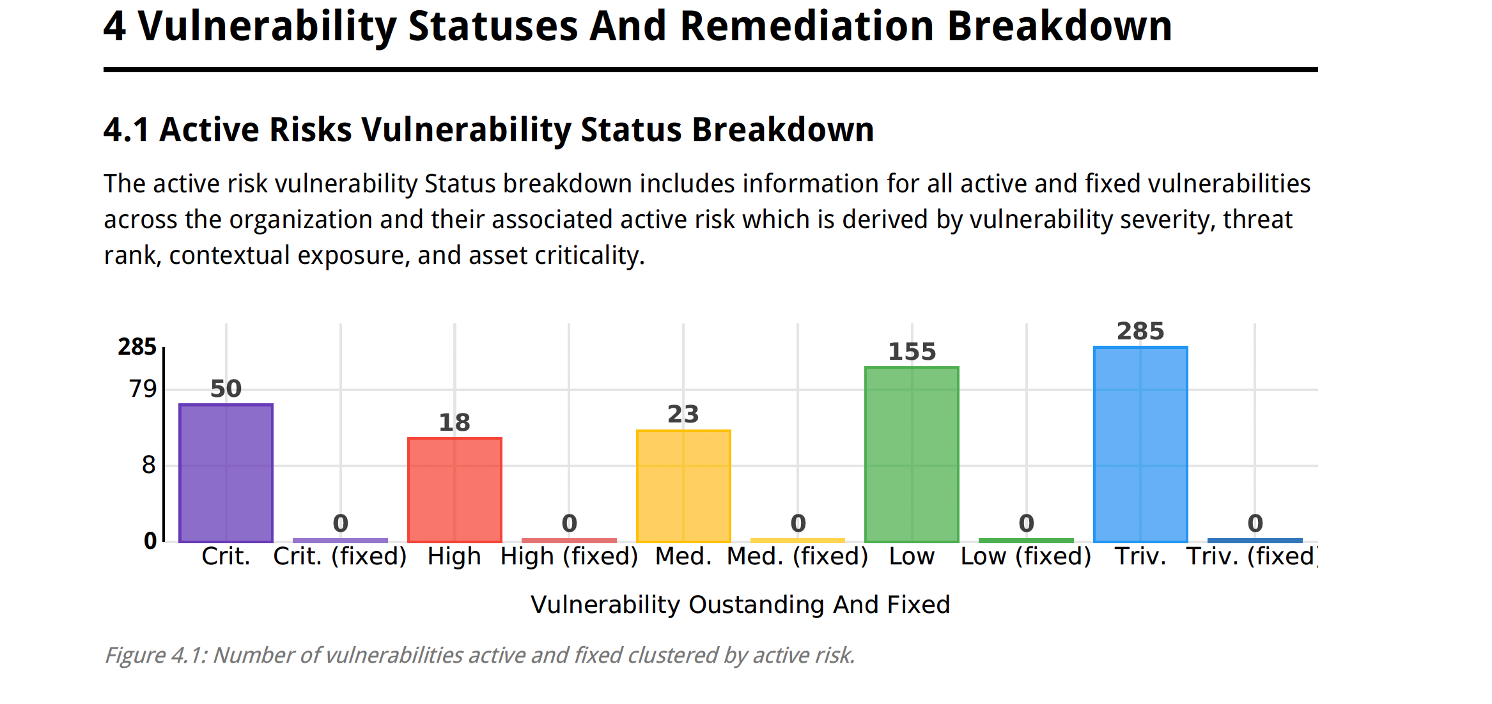
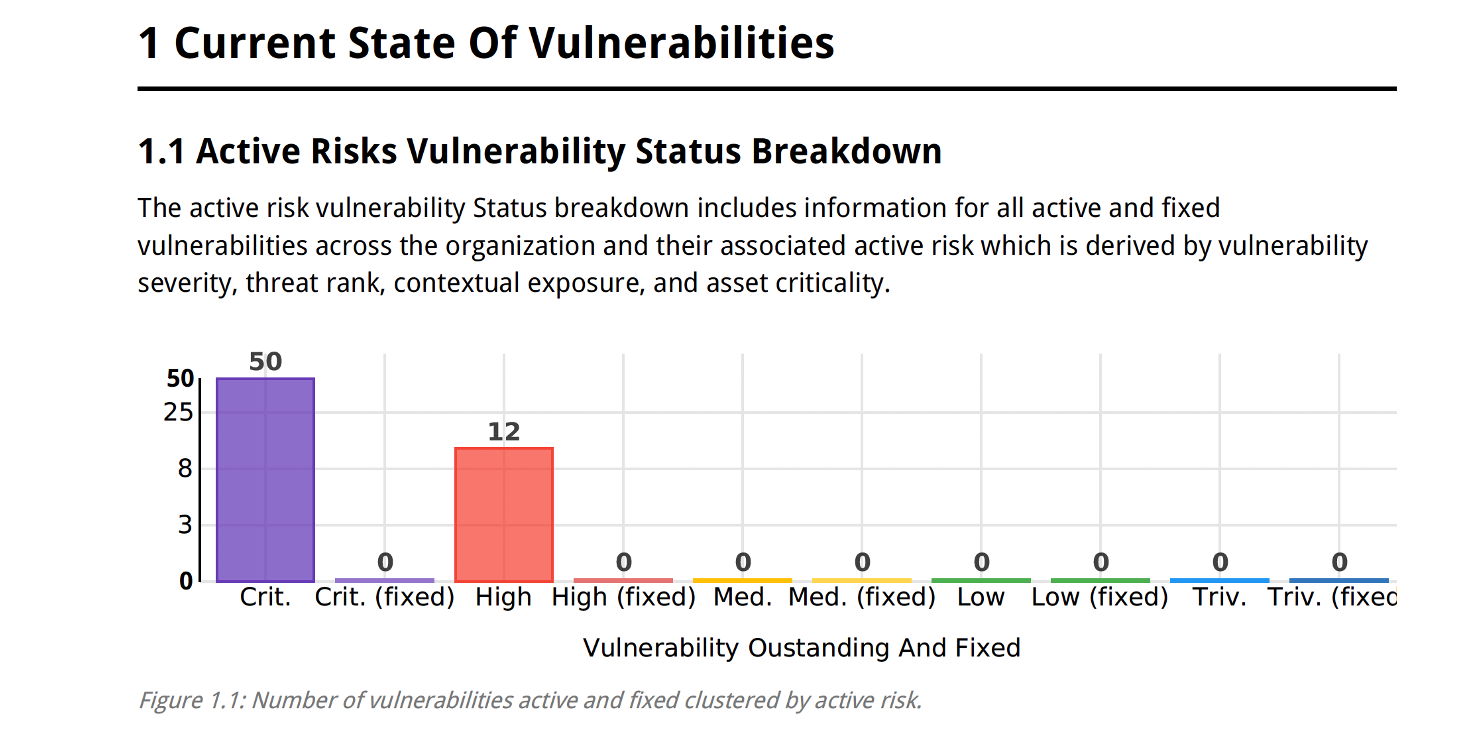
You can view different aspects of your Vulnerability Remediation Plan Report such as Active Risks Vulnerability Status Breakdown.
You can leverage threat intelligence to classify which vulnerabilities are most likely to be exploited to prioritize your remediation efforts to the vulnerabilities that create the largest amount of risk for your organization, instead of attempting to patch all regardless of how likely they are to be exploited in an attack.
