Network Map
The Network Maps feature provides the ability to view network topology, drill into different clusters, filter and sort on various attributes, and take actions such as applying labels, building Asset Groups and running scans. Additionally, this feature can be used to isolate hot-spots on a network which require immediate attention (for example, a cluster lacks anti-virus/endpoint coverage or contains exploitable vulnerabilities).
Network mapping data is derived from several sources of information gathered during both remote and authenticated scans and is currently sourced from Active View.
Access the Network Map
-
From the navigation menu, select Graphs > Network Map.
-
Select a client node. The network map initializes on the sub-net nodes. The network map initializes on the sub-net nodes. From this view the client can see the entire network at a glance, or drill down.
Graph Data
The network map builds its topology using the following data:
- Client’s RNA Network Interface
- Trace-routes observed when scanning assets
- Network Interface and Routing Table data from auth scans
Business Groups
The topology displayed is Business Groups aware depending on the user of the feature. Any assets that are out of scope from the user’s business group will not be displayed on the map.
Graph View
Force-Directed Layout
The graph will algorithmically decide where to put each node on the map depending on size of the node (based on how many assets are clustered in that node) and the edges of that node (connections with other graph nodes).
Sorting Clusters
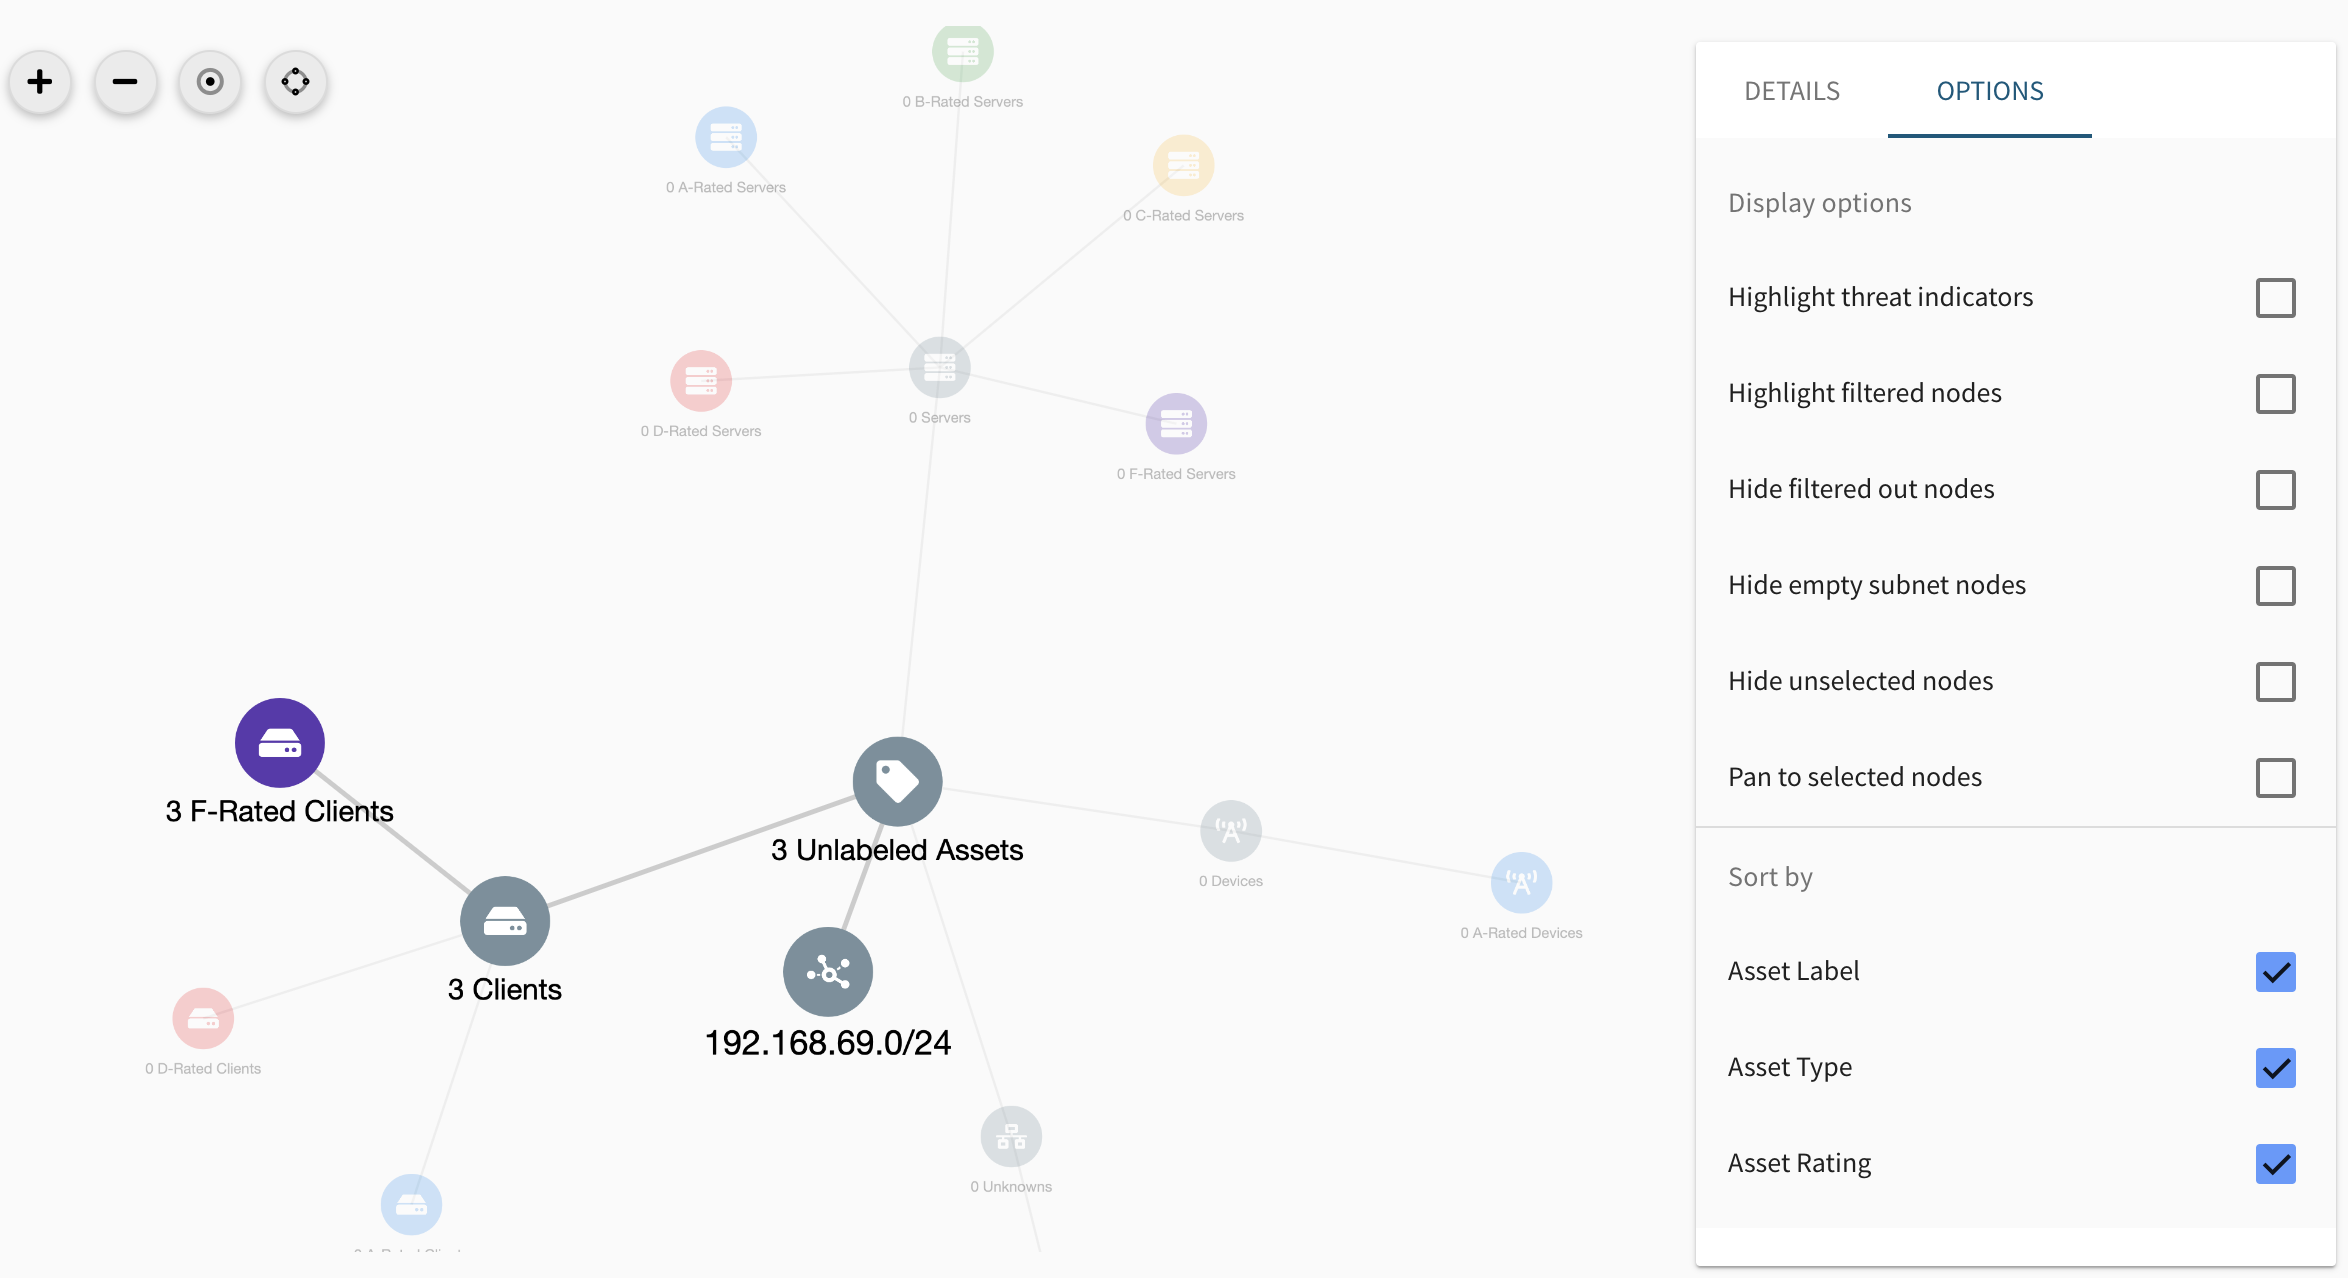
The base level graph nodes are always based on the subnets identified on the network from the network topology data. In order, the tertiary sorting groups are:
- Asset labels
- Asset types
- Asset ratings
A graph with these sorting groups enabled will display the base level subnet nodes branch out into nodes that cluster assets based on asset labels, which then branch out to nodes that cluster assets based on asset type, which then branch out to cluster nodes based on asset ratings.
You can toggle these sorting groups on/off through the Options tab from the side panel.
The side panel displays stats in context of cluster nodes that are selected. These stats include:
- Name of the active cluster
- Rating distribution of assets in the active cluster
- Distribution of assets with vulnerabilities that are exploitable or commonly used by threat actors for all accounts
- Distribution of assets with malware and vulnerable anti-virus for accounts with ATS