Viewing Statistics
In the DMZ Gateway administration interface, you can view a variety of statistics. Whether you click All Profiles or a specific Profile, the Status area displays information about Peer Notification Channels and Client Listeners, as well as the size and speed of server and client data being transferred.
Your selections persist across Profiles; that is, if you click the Client Listeners tab in Profile 3, then click Profile 2, the Client Listeners tab is selected in Profile 2 also.
The status "bubbles up" to the All Profiles node. For example, if there is a problem in Profile 1 causing the icon to turn yellow, the All Profiles icon is also yellow.
In the Profile tree:
-
A red icon
 indicates that
an error exists (e.g. port conflict from external application, IP
address no longer exists, etc.).
indicates that
an error exists (e.g. port conflict from external application, IP
address no longer exists, etc.). -
A yellow icon
 indicates
that the DMZ Gateway service is running, but port conflicts exist
between connected sites, when at least two Sites are connected.
indicates
that the DMZ Gateway service is running, but port conflicts exist
between connected sites, when at least two Sites are connected. -
A green icon
 indicates
that the DMZ Gateway Service is running and at least one Site is connected.
indicates
that the DMZ Gateway Service is running and at least one Site is connected. -
A gray icon
 indicates
that there are no errors and no Servers are connected.
indicates
that there are no errors and no Servers are connected.
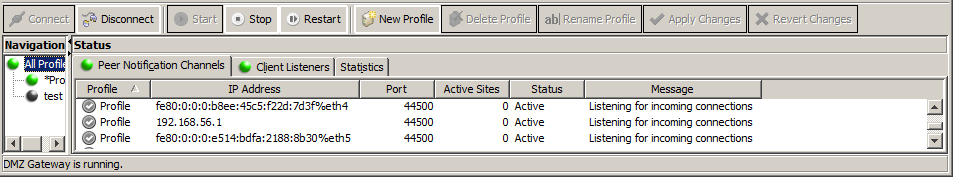
Peer Notification Channels Tab
The Peer Notification Channels tab of the Status panel displays the IP address, port, number of active sites, channel status, and channel status message for each configured server-side IP address for a selected Profile or All Profiles. If All Profiles is selected, a Profile column displays the name of the applicable Profile. (For more about Peer Notification, refer to Introduction to Globalscape DMZ Gateway.)
The following icons provide an indication of channel status:
![]() Active with connected
servers
Active with connected
servers
![]() Active with no connected
servers
Active with no connected
servers
![]() Warning
Warning
![]() Error
Error
The following columns displayed on the tab can be sorted by clicking the column header:
-
IP address - IP address on which Peer Notification Channels communicate
-
Port - Port on which Peer Notification Channels communicates
-
Active Sites - Number of Sites connected to DMZ Gateway
-
Status - Active, Inactive, Warning, Error
-
Message - More information regarding status (for example, Listening for connections, Port already in use)
Client Listeners Tab
The Client Listeners tab of the Status panel displays the PNC address, server IP address, server name, server type, Site name, listener IP address/port, status, and status message. If All Profiles is selected, the Profile column displays the name of the applicable Profile.
The following icons provide an indication of status:
-
 Listening
 -
 Inactive
 -
 Warning
 -
 Error
Error
The following columns displayed on the tab can be sorted by clicking the column header:
-
PNC Address - Server-side IP address on which the server connected to DMZ Gateway
-
Server IP Address - IP address of the remote server
-
Server Name - user-assigned name of connected server
-
Server Type - Type of server, e.g., EFT
-
Site - User-assigned name of Site
-
Listener IP Address - Client-side IP address on which clients connect to DMZ Gateway
-
Listener Port - Port of Listener
-
Status - Active, Inactive, Error, Warning
-
Message - More information regarding status (for example, Listening for incoming connections, Unable to bind to port, Listener creation failure, Closed, Inactive, Listener IP/Port address already assigned)
Statistics Tab
The Statistics tab of the Status panel displays the size and speed of server and client data being transferred. When All Profiles is selected, the aggregated data sizes are displayed, and the Profile column displays the name of the applicable Profile.
The Statistics tab is configured by default to refresh automatically every 15 seconds. You can change the refresh frequency or configure the interface to not refresh automatically. You can also refresh the display manually.
-
To change the refresh frequency, in the Refresh Interval box, provide a new interval, in seconds, then click Apply Refresh Interval.
-
To prevent the interface from refreshing automatically, clear the Enable automatic refresh check box.
-
To refresh the interface manually, click Refresh Now.
The following columns displayed on the tab can be sorted by clicking the column header:
-
Server IP Address- IP address of the server
-
Client Bytes Read/sec - Number of bytes received from Clients
-
Client Bytes Written/sec - Number of bytes sent to Clients
-
Server Bytes Read/sec - Number of bytes received from Servers
-
Server Bytes Written/sec - Number of bytes sent to Servers
-
Accepted Client Connections - Number of successful client connections.
-
Rejected Client Connections - Number of client connections attempted that were rejected.