Debug Panel Overview
The Debug panel contains nine debug views separated by tabs (the active view's tab is always colored blue). Here, you can select the Variables tab to easily view variables and datasets that are contained in the task as well as their initial and current values, or click the Output tab to view step by step information about the task during execution. Each debug view supplies a context menu containing relevant options and commands for that particular view.
Debug Panel Views
The available debug tools are listed below:
| Debug Panel View | Description |
|---|---|
| Debug Panel - Attachments | Lists all the files that are attached to the current task. |
| Debug Panel - Breakpoints | Lists all breakpoints contained in the task and their corresponding steps. |
| Debug Panel - Comments | Displays each comment in the task along with its step number. |
| Debug Panel - Labels | Lists all labels in the task, including the label name and corresponding step number. |
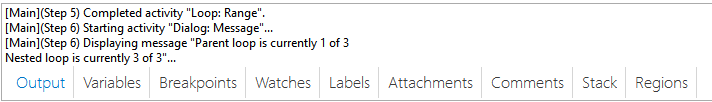
| Debug Panel - Output | Shows detailed step by step information about the task during execution. |
| Debug Panel - Regions | Displays the list of regions contained in the task, including region name and corresponding step number. |
| Debug Panel - Stack | Displays the depth of the currently running task. When a sub-task is running, its immediate parent is listed below it. |
| Debug Panel - Variables | Lists variables and datasets that are contained in the task as well as their initial and current values. |
| Debug Panel - Watches | Shows all currently set watches and displays the evaluated values for the watched variables and expressions as the task runs. |