Linux Process Reporting
Provides reporting on the processes running on a Linux system.
- From the required Linux System - Reporting Monitor main panel, click Add Field.
- From the Select Category dialog, select CPU.
This opens the CPU, Filesystem and Memory reporting dialog at the CPU Performance Group.

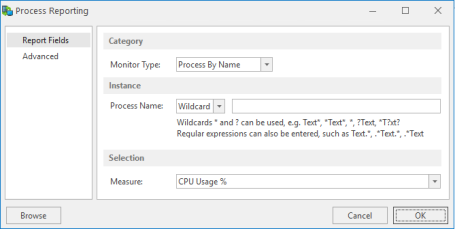
Category section
Monitor Type
There are three possible options when selecting the Process Monitor Type:
- Process By Name
- Process By Owner
- Process By PID
Instance section
Process Name
Either type the name of the Linux process on which reporting is required or use Wildcards or Regular Expressions (Regex) to define the name of the process.
Selection section
Measure
From the drop-down choice menu select one of the following options:
- CPU Usage %: Reports on the amount of CPU (expressed as a percentage value)
- Cumulative CPU Time: Reports on the cumulative CPU Time used by the selected process
- Elapsed Time: Reports on the time elapsed since the selected process was started
- Number of Processes: Reports on the number of processes running under the selected name
- Process Physical Memory Used: Reports on the amount of physical memory used by the selected process
- Process Physical Memory Used %: Reports on the amount of physical memory used by the selected process expressed as a percentage value
- Virtual Memory Size: Reports on the amount of virtual memory used by the named process
Process Browse
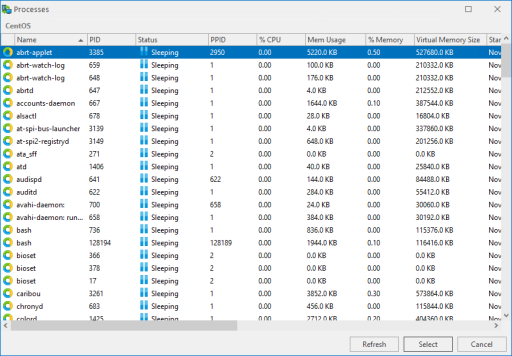
It is also possible to select any additional processes that may be running on this system for inclusion in Linux Reporting.
From the Process Reporting dialog, click Browse to open the list of Processes for this system.

Use the vertical scroll bar to move through the list of available processes.
- Click on a process so that it is highlighted and click Select to automatically add the process so that it appears in the Process Name parameter of the Process Reporting dialog.