Working with Widgets
Use the following techniques to create, edit, and manage Analytics's dashboard widgets.
You can add as many widgets as you need to your dashboard. For many of the widgets, you can even add more than one of each kind. But, be aware that number of widgets on the page does affect the response time. Also, you can only add widgets to dashboards that you have created. Shared dashboards created by another user are view-only.
Steps
-
On the Analytics home screen, select
 Dashboard from the navigation menu.
 -
Select the dashboard name.
-
Toggle Edit mode On.
-
Put focus on an empty dashboard panel and press Add widget.
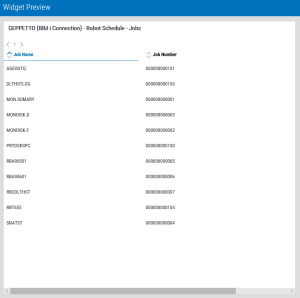
The Widget Preview window displays and the Add Widget panel opens on the right.
-
Link to a data source by:
-
Choosing an existing Data Source
-
Create the widget with no Data Source
-
Add a new Data Source by selecting a connection and product.
See Product Connections for more information.
-
-
Choose the Asset you would like included in the widget.
-
If desired, edit the Widget Name.
-
Select a Widget type.
NOTE: The Widget types available will vary depending on your choice of Asset. -
Use the Data tab to select the metrics to display in the widget (if applicable).
-
Use the Layout tab to set Widget Settings as desired.
NOTE: The Widget Settings available will vary depending on your choice Data Source, Asset, and Widget type. See Settings Tabs for more information. -
Use the Styles tab to toggle Color Theme to "custom" to set a color for this individual widget instead of using what was set for the dashboard. Then, select a color.
NOTE: This will override the color theme set for the dashboard. For more information, see Working with Dashboards. -
When that the widget meets your expectations in the Widget Preview window, press Save.
NOTE: If you want to add more than one widget of a particular type, for example, if you want to add two job history widgets, repeat the above steps for each one. -
To customize the widgets you added make sure Edit mode is On and pressEdit Widget on any widget to edit its settings.
The Widget Preview window displays whenever you add or edit a dashboard widget. It displays to the left of the Add/Edit Widget Panel and will automatically update as you make changes to the Data Source, Assets, Widget Type, and Metrics. You can see the effect of your changes to Settings Tabs before you save to your dashboard to ensure that the data presented in your widget will meet your needs.
Notes:
- A warning message will display in the Widget Preview window when no data satisfies your criteria.
- Updating Column Order and Default Sorting in List Settings will update those properties in the preview window.
Once your widgets have been created, you can view your widget in full-screen mode.
To view a widget in full-screen mode:
- On your dashboard, ensure that Edit mode is set to Off.
- Click the full screen view icon
 in the upper-right portion of the widget you wish to view in full-screen mode.
 - To revert, click the normal view icon
 in the upper-right portion of the widget.
Currently, you can perform row actions on the Robot Network Statuses widget. For more information about the Robot Network actions available to you, see the Status Center information.
To perform row actions on a widget:
- On your dashboard, ensure that Edit mode is set to Off.
- Select the Show Actions
 icon on the end of the row of the widget you wish to perform row actions on. The possible actions for the Statuses widget are:
- Properties
- Performance Details
- Reply
- Acknowledge
- Escalate
- Assign
- Assign to Me
- Unassign
- Close
- Depending on your selection, available actions will be presented to you on either a popup window or a side panel.
- Complete the action.
You can only delete widgets and widget groups from dashboards that you have created. Shared dashboards created by another user are view-only.
-
On the Analytics home screen, select
 Dashboard from the navigation menu.
 -
Select the dashboard name.
-
Toggle Edit mode On.
-
Press Delete on the widget or widget group you want to delete.
