Adding Widgets
You can add as many widgets as you need to your dashboard. For many of the widgets, you can even add more than one of each kind.
You can only add widgets to dashboards that you've created. Shared dashboards created by another user are view-only.
To add a widget to Vityl IT & Business Monitoring:
- From the Dashboards panel, select the dashboard to which you want to add the Vityl IT & Business Monitoring widget.
- Ensure that Edit Mode is on. If the Dashboard header bar is displayed on a blue background, the dashboard is in view-only mode. Click the Edit mode toggle switch to enable Editing. The Dashboard header bar is now displayed on a yellow background to indicate that editing is available.
- Use an existing (or create a new) section on the dashboard and click Add Widget.
- From the Add New Widget panel select the Data source from which this widget will retrieve the data. This can either be from a Data Source for which you have already created a widget (use the Select Existing Data Source menu) or a new Data Source based on the Product Connections that you have available.
- Click Next.
- Select the asset from those that have been defined in Vityl IT & Business Monitoring for this data source. Click the
 symbol next to an asset to view and select any additional assets that may have been defined beneath this level.
-
The widget Name is taken directly from the name of the selected asset. If required, over-type this entry with a new name for this widget.
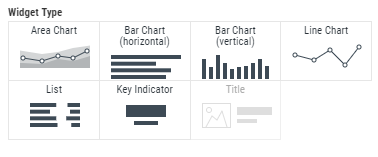
- Select the Widget type that will be used to display the data. Additional selections are dependent on the chosen widget.
Widgets are selected from a series of icons that depict the visual result of the selection.

The Chart widget displays data from the selected data source and business metric combination in the form of a chart based on an 'X' and 'Y' axis. For some Performance Metrics, two different indicators can be selected and displayed in the same chart.
The following parameters are used exclusively when adding a Chart widget:
Color theme
Select the option for the background of the chart widget.
- Light: This is the default setting and uses a plain white background on which the chart data is displayed.
- Dark: This setting displays the chart data on a black background.
- Blue: This setting displays the chart data on a blue background.
Select Metrics
The Select Metrics section of the Chart widget allows you to define up to 2 different metrics for the selected asset to be displayed on the chart. The available metrics depend on the asset.
Use the Advanced Settings section to apply the following configuration options to the Chart widget.
Fixed Time Range
By default, the Chart widget uses the default time range that applies to the dashboard. Toggle the switch On to be able to specify the actual time period for which the Chart data is displayed in this widget.
Compare with Previous Period
By default, the Chart widget uses the default Compare with Previous Period setting that applies to the dashboard. Toggle the switch to Custom and then select the Custom setting as On to specify that the data displayed in this widget can be set independently from the default dashboard settings.
Auto Refresh
By default, the Chart widget is set to inherit the auto-refresh settings that are applied to the dashboard. Toggle the switch On to be able to specify a new auto-refresh time period that is applied exclusively to this widget.
Non Value Axis
For Chart widgets, this is set to Date and Time and is used to provide an identifier to the chart (X) axis that does not use a value from the selected metric.
Layout
The chart can take any one of the following formats:
- Line: The returned data is displayed in the form of a single line.
- Area: The returned data is displayed in the form of a shaded area.
- Bar: The returned data is displayed in the form of a horizontal bar graph.
- Column: The returned data is displayed in the form of a vertical bar graph.
- Min/Max: The returned data is displayed as the minimum and maximum extremities of the captured data in a 'candlestick' type display. This chart is only available if only one metric is selected.
- Stacked Area: The returned data is displayed in the form of a shaded area but colorized to represent the different thresholds defined within the metric.
- Stacked Bar: The returned data is displayed in the form of a horizontal bar graph but colorized to represent the different thresholds defined within the metric.
- Stacked Column: The returned data is displayed in the form of a vertical bar graph but colorized to represent the different thresholds defined within the metric.
Header
The header is used to display the time period for which the Chart widget is reporting the data. Toggle the switch On and Off to show or hide the header information as required.
Title
The title is the name that has been provided for this widget. If this has not been amended, the title is the name of the asset for which the Chart widget is reporting data. Toggle the switch On and Off to show or hide the widget title as required.
Legends
Legend text is used to identify each metric that is displayed on the chart. By default the Legends setting is On. Toggle the switch to Off to hide the Legend text from the Chart widget display.
Grid Lines
Grid lines are used on the Chart widget display to assist in the visualization of the displayed data. When active, grid lines run horizontally across the chart from each value displayed on the 'Y' axis. This helps determine accurate values when pinpointing specific points from the displayed data in the chart. By default the Grid Lines setting is On. Toggle the switch to Off to hide Grid Lines from the Chart widget display.
Thresholds
Thresholds are used on the Chart widget display to assist in the visualization of the displayed data. Threshold levels are only available for metrics for which such information can be defined. When active, threshold warning levels, such as Critical and Warning are displayed against the value at which they are set for the metric. This enables you to quickly determine exactly if and when the threshold limits were exceeded and for what period of time. By default the Thresholds setting is On. Toggle the switch to Off to hide Thresholds from the Chart widget display.
Axis Label
The Axis Label is used on the Chart widget display to identify the values displayed on the left (Primary) and right (Secondary) of the 'Y' vertical axis. Toggle On or Off to show or hide the labels as required.
Primary Axis Label
If the Axis Label is set to Show, toggle this switch to determine whether the Primary Axis shows the Default name as taken from the selected metric or a Custom name. If the Custom name option is selected, enter the text that you want to display as the Primary Axis label.
Primary Axis Unit Label
If the Axis Label is set to Show, toggle this switch to determine whether the Primary Axis shows the Default unit measurement as taken from the selected metric or a Custom unit measurement. If the Custom unit measurement option is selected, enter the text that you want to display as the Primary Axis Unit label.
Primary Axis Range
The Primary Axis Range is used to define the range of values on the Primary Axis for which the chart data is displayed. Toggle this switch to select from the Default range as taken from the selected metric or a Custom range. If the Custom range option is selected, enter the minimum and maximum unit values to be displayed on the Primary Axis.
Secondary Axis Label
If the Axis Label is set to Show, toggle this switch to determine whether the Secondary Axis shows the Default name as taken from the selected metric or a Custom name. If the Custom name option is selected, enter the text that you want to display as the Secondary Axis label.
Secondary Axis Unit Label
If the Axis Label is set to Show, toggle this switch to determine whether the Secondary Axis shows the Default unit measurement as taken from the selected metric or a Custom unit measurement. If the Custom unit measurement option is selected, enter the text that you want to display as the Secondary Axis Unit label.
Secondary Axis Range
The Secondary Axis Range is used to define the range of values on the Secondary Axis for which the chart data is displayed. Toggle this switch to select from the Default range as taken from the selected metric or a Custom range. If the Custom range option is selected, enter the minimum and maximum unit values to be displayed on the Secondary Axis.
Click Save to add the widget to the dashboard.
The Key Indicator widget is used to display both the health status of the current asset and, if available, summarized value data of an important business asset.
The following parameters are used when adding a Key Indicator widget and can vary depending on the type of asset chosen:
For Business Assets that just return a health status
In this option, the select metric option can only be used to define the health status.
In the Select Metrics column, click Health.
Use the Advanced Settings section to apply the following configuration options to this Key Indicator widget.
Auto Refresh
By default, the Key Indicator widget is set to inherit the auto-refresh settings that are applied to the dashboard. Toggle the switch On to be able to specify a new auto-refresh time period that is applied exclusively to this widget.
Header
The header is used to display the time period for which the Key Indicator widget is reporting the data. Toggle the switch On and Off to show or hide the header information as required.
Title
The title is the name that has been provided for this widget. If this has not been amended, the title is the name of the asset for which the Key Indicator widget is reporting data. Toggle the switch On and Off to show or hide the widget title as required.
Show
For Business Assets that are just capable of returning their Health Status, this field is set to Status and cannot be amended.
Use Status Color As Widget Background
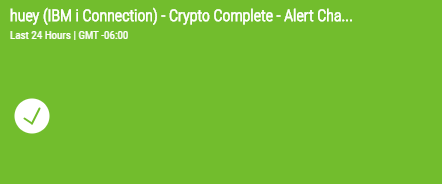
Toggle the switch to show to set the background of the widget to the same color as the health status as shown in the example below:

Otherwise, leave this set to default to use the default background from the dashboard.
Unit Label
Leave this set to default to use the default unit label or set to custom to be able to enter text to customize the unit label.
Click Save to add the widget to the dashboard.
For Business Assets that return both a value and the health status
In this option, the select metric option is used to define a value rather than the health status. The health status is automatically resolved.
Select Metrics
The Select Metrics section is used to define the metric for which the Key Indicator widget applies. The available metrics depend on the chosen asset but will usually include all or some of the following:
- Count: The number of transactions processed in a given time period for the selected asset.
- Response Time: The time taken to respond to the request within the selected asset.
- Real User Experience: The calculation of specific metrics that reflect the actual response times and processes completed as experienced by a user within the selected asset.
- Simulated User Experience: The calculation of specific metrics that reflect the expected activity, times and processes that a user would experience within the selected asset.
- Business Activity: A metric that expresses a single element of business activity within the selected asset.
Use the Advanced Settings section to apply the following configuration options to this Key Indicator widget.
Fixed Time Range
By default, the Key Indicator widget uses the default time range that applies to the dashboard. Toggle the switch On to be able to specify the actual time period for which the Key Indicator data is displayed in this widget.
Compare with Previous Period
By default, the Key Indicator widget uses the default Compare with Previous Period setting that applies to the dashboard. Toggle the switch to Custom and then select the Custom setting as On to specify that the data displayed in this widget can be set independently from the default dashboard settings.
Auto Refresh
By default, the Key Indicator widget is set to inherit the auto-refresh settings that are applied to the dashboard. Toggle the switch On to be able to specify a new auto-refresh time period that is applied exclusively to this widget.
Header
The header is used to display the time period for which the Key Indicator widget is reporting the data. Toggle the switch On and Off to show or hide the header information as required.
Title
The title is the name that has been provided for this widget. If this has not been amended, the title is the name of the asset for which the Key Indicator widget is reporting data. Toggle the switch On and Off to show or hide the widget title as required.
Show
The following options can be displayed.
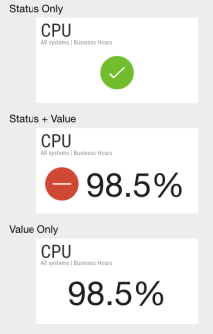
- Status: Just the current Health Status is displayed
- Value: Just the current metric value is displayed
- Status and Value: Both the Health Status and Metric Value is displayed

Use Status Color As Widget Background
Toggle the switch to show to set the background of the widget to the same color as the health status as shown in the example below:

Otherwise, leave this set to default to use the default background from the dashboard.
Indicator
This parameter is used to specify the type of Key Indicator to be used for the selected metric in this widget. Only one selection can be made in this parameter.
- Last value - Displays the last value retrieved in the selected time period.
- Average value - Displays the average value as taken over the selected time period.
- Sum of all values - Displays the sum of all the values retrieved over the selected time period.
- Min Value - Displays the minimum value retrieved in the selected time period.
- Max Value - Displays the maximum value retrieved in the selected time period.
Unit Label
Leave this set to default to use the default unit label or set to custom to be able to enter text to customize the unit label.
Click Save to add the widget to the dashboard.
The List widget displays a list of Issues and, dependent upon the selected asset, Performance metrics that are currently affecting the asset.
Click on the issue to access it directly from within Vityl IT & Business Monitoring.
The following parameters are used when adding an List widget:
Select Metrics
The Select Metrics section is used to define the metric for which the List widget applies. For all asset selections, Issues metrics are available. Performance metrics are available for any asset against which definable thresholds, such as response times, availability, transactions and errors can be applied. If Performance metrics are not available for the selected asset, they are not displayed for selection in the Select metrics section.
Issues
In the Select Metrics section, select the type of issues to be displayed in this widget.
If no Performance metrics are available for the selected asset, just the issue metrics are displayed. If Performance metrics are available, the Issues section must be selected to reveal the available issue metrics.
The following Issue Types are available:
- Location: Select this option to display the host and application on which the selected asset is running.
- Name: Select this option to display the name of the process that is causing the issue to be reported.
- Reason: Select this option to display the reason why the issue has been raised.
- Start: Select this option to display the time at which the issue was raised.
- Status: Select this option to show a graphical representation of the current status.
Performance
If Performance metrics are available for the selected asset, click Performance to display the possible metrics that can be applied to this widget. Performance metrics are used to assess performance of the selected asset against defined thresholds.
Use the Advanced Settings section to apply the following configuration options to the List widget.
Fixed Time Range
By default, the List widget uses the default time range that applies to the dashboard. Toggle the switch On to be able to specify the actual time period for which the List data is displayed in this widget.
Auto Refresh
By default, the List widget is set to inherit the auto-refresh settings that are applied to the dashboard. Toggle the switch On to be able to specify a new auto-refresh time period that is applied exclusively to this widget.
Grouping Field
For List widgets, this is set to Date and Time and cannot be amended.
Header
The header is used to display the time period for which the List widget is reporting the data. Toggle the switch On and Off to show or hide the header information as required.
Title
The title is the name that has been provided for this widget. If this has not been amended, the title is the name of the asset for which the List widget is reporting data. Toggle the switch On and Off to show or hide the widget title as required.
List Settings
Use the List Settings section to define the column order and default sort setting for any metrics selected for this widget.
Column order
By default, column order is set by the order in which the metrics were selected. The first metric selected is shown in the first column, the second metric in the second column and so on. To change the order in which the columns are displayed in the widget, single-click on the metric that you want to move and drag it to the new position in the list, then release the mouse button. Click Save to confirm the new widget settings.
Sort Settings
The current sort setting for each metric is shown by the direction of the blue arrow in the Sort By column. If no arrow is highlighted, select the order in which you want to sort column by clicking on the required directional arrow.

To change the Sort order, click the opposite arrow to the one that is currently highlighted.
Click Save to add the widget to the dashboard.
The Title widget can be used to display your company’s branding in order to share the contents on a big screen, to the higher business levels and in reports or presentations. Format options allow you to specify:
To add a Title widget:
- From the Add Widget panel, select the existing data source as Create widget with no data source. As no Data Source is used the Assets panel can be bypassed.
- In the Widget section, select the Title widget.
- Click Advanced Settings to display configuration options for the widget.
Use the Advanced Settings section to apply the following configuration options to the Title widget.
Title
Type the Title name that you want displayed at the top of this widget. This should accurately reflect the nature of the data being displayed inside the widget.
Subtitle
Type the Subtitle (if any) that you want displayed in this widget The Subtitle can be used to give further clarification to the purpose of the widget.
Text Align
Use the Text Align feature to determine the position of the Title and Subtitle text within the widget. By default, all text is left-aligned.
- Left: Text is aligned with the top left-hand side of the widget.
- Right: Text is aligned with the top right hand side of the widget.
- Centrally: Text is aligned in the top middle of the widget.
Background Options
These options allow you to specify the how the background of this widget is displayed. Company logos (or other images), and background colors can be used to differentiate this widget from others in the dashboard.
- Image: An Image can be selected and displayed as the background on this widget. Use the File option to choose a file and set the subsequent alignment options to position it as required within the widget.
- None: No background image or color is set for this widget.
- Solid Color: Use the available color schemes, Light (default), Dark or Blue to define the background display of this widget.
Widget Links
Widget links can be used to jump to another dashboard within this installation of Insite or an external URL by clicking a link contained within the widget.
The following options are available.
- None: No link is provided from within the title widget.
- External URL: In the URL field, enter the full address of the external URL to which the link will go when clicked. If no alternative text is provided, the full link is shown under the title. If required, enter alternative text in the Link Display Text field to display in place of the actual URL. The actual link remains the same.

Title Widget with URL link

Title Widget with Display Text
- Dashboard: If Dashboard is selected, a list of alternative dashboards available in this installation of Insite is displayed. Select the dashboard to which you want the link to go to when clicked. Only one dashboard can be selected per Title widget.

Title Widget with Dashboard link
Click Save to add the widget to the dashboard.