Automate Diagnostics
Automate Enterprise is essentially a collection of individual components that work together to act as one cohesive unit. Components such as the management server, execution server, agents and management tools communicate with each other by the way of TCP/IP, whether remotely or on the local system. This enables you to customize installation of each component to best fit your organization's needs.
The Automate Diagnostics page helps you evaluate and monitor the hardware performance of your Automate Enterprise environment. You can view memory and CPU usage as well as handle and thread counts consumed by your Automate Enterprise management and execution servers. The data is presented in a manner that's easy to convey and manage.
Getting there: In the navigation pane, clicktap Automate Diagnostics under the Automate menu.
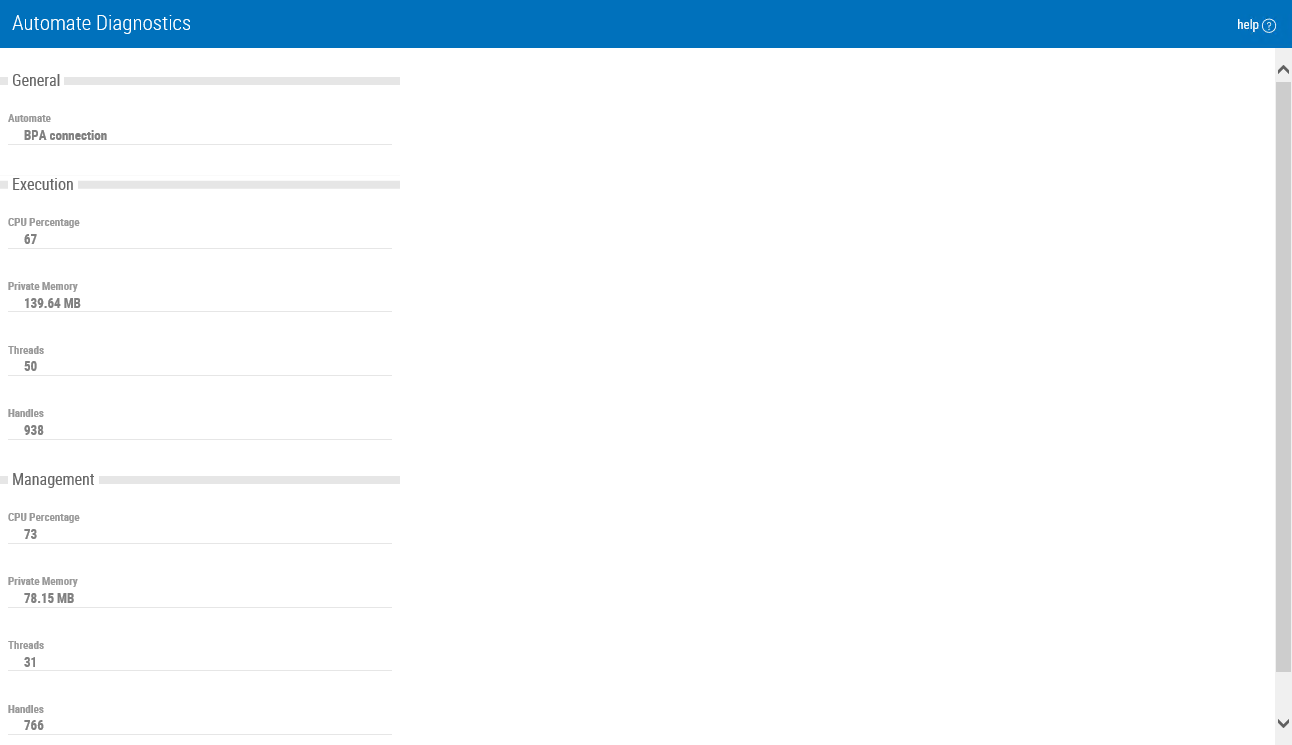
General
The General section displays the default Automate Enterprise from which diagnostics data are gathered. If multiple Automate Enterprise installations exist, a default can be configured by the way of the Default Automate parameter located in the Preferences page.
Execution
The Execution section displays execution server diagnostics. The execution server is responsible for communicating information with regards to which agent should execute the proper workflow objects, and thereafter, transmits all execution statistics back to the management server. Automate Enterprise agents communicate directly with the execution server.
Management
The Management section displays management server diagnostics. The management server is responsible for storing information regarding workflow objects as well as audit and execution data. It is basically the repository off all Automate Enterprise information. The Automate Enterprise Management Console and Workflow Designer communicates directly with the management server.
Diagnostics Data
Below describes the hardware data being monitored:
- CPU Percentage - Displays the total CPU percentage being used by the management or execution server. The percentage refers to how much of the individual CPU’s capacity is in use. CPU percentage is typically used to track CPU performance regressions or improvements when running Automate Enterprise workflows, tasks or processes.
- Private Memory - Displays the private memory size (in megabytes) used by the management or execution server. The private memory, also known as private working set, is the amount of "real" memory that can only be used by the process it is allocated to.
- Threads - Displays the number of threads being used by the execution or management server. A thread is a part of a program that can execute independently of other parts. Operating systems that support multithreading enable threaded parts of a program to execute concurrently.
- Handles - Displays the handle count being used by the execution or management server. A handle is an element that enables a program to access a specific resource, such as a library function.