Dashboards Overview
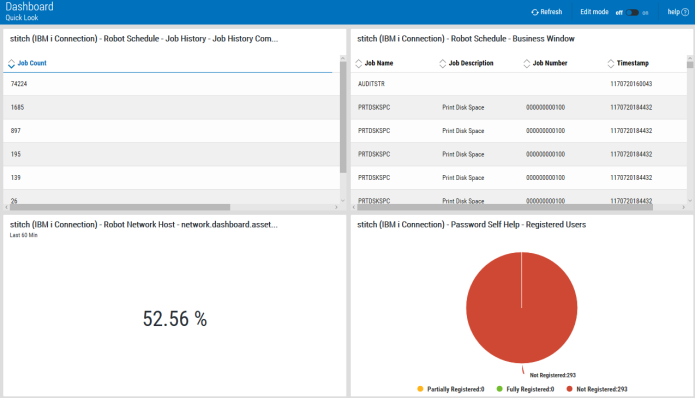
The Robot Network dashboards display information from the systems that Robot Network monitors. Use the dashboards for viewing and analyzing data from across your network all on one screen. You can quickly view the number of jobs on each system, what percentage of your messages are being answered automatically by Robot Console, your CPU usage, your ASP usage, the interactive response time on the systems, and more.
You can create more than one dashboard, sharing them with everyone or keeping them private, as needed. Also, performance metrics and product metrics are not separated as they are in the Robot Network GUI. You can use any combination of widgets in the same dashboard.
