Performance Metrics
Use the Performance Metrics section of the Host Properties page to set purging options for dashboard widget summaries and details.
In the Navigation Pane, clicktap My Network under the Robot Network menu. If the menu is hidden, hover over the Navigation Pane to expand it. Then, clicktap  Show Actions next to the host you want to view and select Host Properties.
Actions you can take:
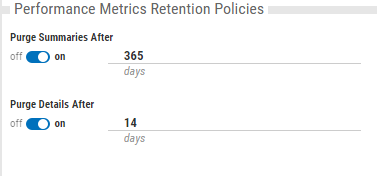
Note: Summary data is used for graphs spanning more than one day. Detail data is used when you're viewing daily graphs.
-
ClickTap the Purge Summaries After button to enable (On) or disable (Off) if summary data and records should be purged automatically.
-
If Purge Summaries After is enabled, type in the field or use the arrows to enter how many days you want to retain summary data before automatically purging it.
-
ClickTap the Purge Details After button to enable (On) or disable (Off) if detail metrics should be purged automatically.
-
If Purge Details After is enabled, type in the field or use the arrows to enter how many days you want to retain detail metrics before automatically purging it.
When you're finished, clicktap Save.