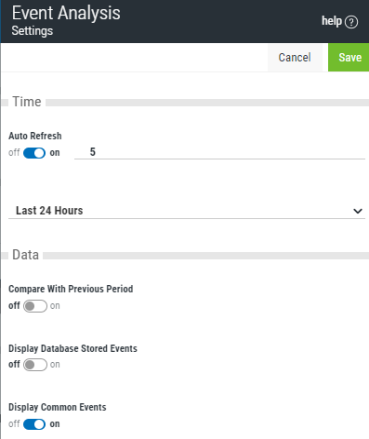
Editing the Event Analysis display allows you to set the default parameters for using Event Manager. The filter settings amended here, then become the default settings for any future sessions. To amend the settings for just the current session, use the Filter functionality.
Click Edit in the Event Analysis header. The Event Analysis Filter panel opens.

Auto-Refresh
Use this setting to determine (if any) the period at which the data is automatically refreshed on the Event Analysis display. The current setting is 5 minutes.
Either over-type the current entry or use the up/down arrows to change the setting in the required direction.
If this setting is turned off, you can use the manual refresh facility on the Edit Analysis display page.
Time Range
Use the drop-down menu to select a new time period over which security event data is displayed. The following choices are available:
- Last 60 Minutes
- Last 24 Hours
- Today
- Yesterday
- Last 3 Days
- This Week
- Past Week
- This Month
- Past Month
- Last 6 Months
- Last 12 Months
- Custom...
Compare With Previous Period
Enable this option to display an additional line on the Events panel showing the comparative data for the corresponding previous time period. This setting is off by default.
Display Database Stored Events
Enable this option to display only those events that have actually been stored in the database. By default, the Event Analysis displays the total number of events including repetitions of summarized events.
Display Common Events
Common events are the everyday security events that are processed through the system without necessarily posing a security risk. These events can make viewing the important detail difficult. By default, the Event Analysis view includes these common events. Toggle this switch to remove the common events from the display.
Click Save to confirm the default settings on the Event Analysis display.