Overview Navigation
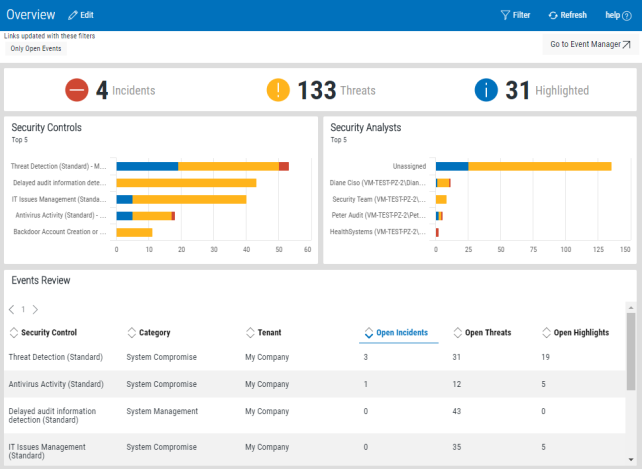
The Overview page of Event Manager for Insite contains four panels:
Use the following displays and options to navigate through the Overview display.

Edit
Click Edit to be able to set the Auto Refresh time interval for this display. The default setting is 5 minutes.
Refresh
Click Refresh to instantly update the information on this display.
Event Manager
Click Go to Event Manager  to open the instance of Event Manager to which this Insite connection is made.
Incidents, Threats, and Highlights Summary Totals panel
In the Overview header bar, a summary of all the open incidents, threats and highlighted events is shown. This gives a quick, at-a-glance view of the workload faced by the security analytical teams.
The default view shows the current open events.

The summary counts are taken from the events for each audit control against which an event has been logged.
Each of these counts can be interrogated to provide a more in-depth view of each summary total. See Overview Drill-down for more information.
Security Controls and Security Analysts panels
These two panels share the same characteristics and functions.
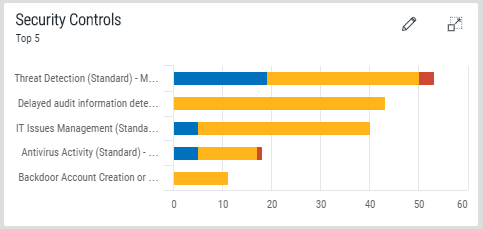
- The Security Controls panel shows, by default, the Top 5 security controls currently facing your organization.
- The Security Analysts panels displays the same information but broken-down by the analyst to which the vent is currently assigned.
This information is displayed in the form of a bar chart, with the respective colors showing the corresponding threat level, with the size of each segment representing the number of events in each category.

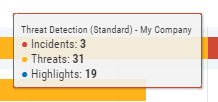
Hover the mouse pointer over any of the displayed bars to display a tip window showing the exact number of incidents, threats and highlights represented.

As with the incidents, threats and highlights panel, any of these counts can be interrogated to provide a more in-depth view of each summary total. See Overview Drill-down for more information.
Editing the Security Controls and Security Analysts displays
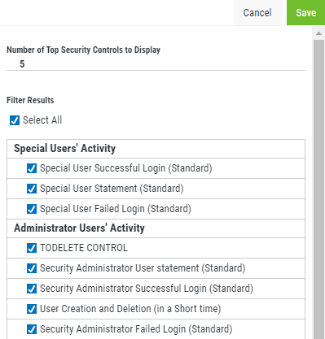
By default, the Top 5 security controls or security analysts are displayed in these panels. This can be changed by clicking the ![]() Edit icon which becomes visible when the mouse pointer is fully positioned within either panel. A menu panel appears to the right of the display.
Edit icon which becomes visible when the mouse pointer is fully positioned within either panel. A menu panel appears to the right of the display.

Number of Top Security Controls/Security Analysts to Display
The default number of security controls/analysts to display at any one time is 5. Over-type this number with a new value if required and click Save.
Filter results
These options can be used to include or exclude specific security controls/analysts from the display.
Click Select All to include all security controls/analysts in the relative panels, otherwise click on individual controls/analysts within the subsequent list to include or exclude as required. Use the vertical scroll-bar to view additional options that may not initially be visible.
Click Save to confirm the changes.
Events Review panel
The Events Review panel displays an analytical breakdown of the Security Control graph by providing textual information relating to each of the security controls.
There may be additional information displayed in this panel if more than five separate security controls exist but only the top 5 are displayed in the Decurity Controls panel.

The following information is displayed:
- Security Control: Displays the name of the security control as defined in Event Manager.
- Category: Displays the category under which the event is defined
- Tenant: Displays the name of the tenant who is affected by the Event
- Open Incidents: The current number of open incidents for the named security control
- Open Threats: The current number of open threats for the named security control
- Open Highlights: The current number of open highlights for the named security control
Any of these counts can be interrogated to provide a more in-depth view of each summary total. See Overview Drill-down for more information.
Maximizing a panel
Any of the panels on the Overview display can be maximized so that they fill the available display area.
Click the ![]() maximize icon which becomes visible when the mouse pointer is fully positioned within any panel.
maximize icon which becomes visible when the mouse pointer is fully positioned within any panel.
To reset the display to the default setting, click the ![]() minimize icon.
minimize icon.