Nagios Plugins
Intermapper command-line probes are similar to Nagios® plugins (http://www.nagios.org). You can see the standard set of Nagios plugin. Many vendors and individuals have created their own Nagios plugins, many of which are available in the development section. To use these plugins, download them and build and compile them yourself.
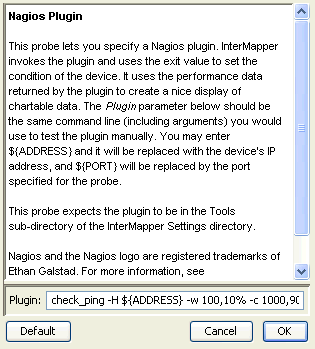
The Nagios Plugin probe allows you to specify a Nagios plugin to run, along with associated parameters. You can use the ${ADDRESS} and ${PORT} macros in the command-line; Intermapper substitutes the device IP address and the specified port. Intermapper invokes the plugin and uses the exit value to set the condition of the device to UP/Okay, UP/Alarm, UP/Critical, or DOWN.
Intermapper also interprets the information written by the plugin to stdout and puts it in the Intermapper Status window, displaying and making performance data returned by the probe chartable. It also displays the reason/condition provided.
The Nagios Plugin probe expects the Nagios plugin to be in the Tools sub-directory of the Intermapper Settings directory. Nagios and the Nagios logo are registered trademarks of Ethan Galstad. For more information, see http://www.nagios.org/.
To install and use a Nagios plugin:
- Download the plugin. Make it executable by following the instructions from the creator.
- Move the executable file (or a link/alias/shortcut to it) to the Tools
sub-directory
of the Intermapper Settings directory. - Add a device to the map and set the device Probe Type to Nagios Plugin.
- Enter the plugin file name and arguments in the Plugin field of the configuration window.
- You can use the ${ADDRESS} and ${PORT} macros in the command line. Intermapper substitutes the device IP address and the specified port.
Creating Nagios Probes
If you want to develop your own Nagios plugin, follow the developer guidelines for Nagios (found at http://nagiosplug.sourceforge.net/developer-guidelines.html). This results in probes/plugins that work for both Intermapper and Nagios.
As described in the Nagios Guidelines, a Nagios plugin returns the following:
- A POSIX return code as described in section 2.4 of the Guidelines. Intermapper uses this to determine the device state.
- 0 = OK
- 1 = Warning (yellow)
- 2 = Critical (red)
- 3 = Down
-
A single output line on STDOUT with the following format:
<description of the device status>|Perfdata
where:
-
<description of the device status> is a short text string. This becomes the Intermapper Condition string and is described in section 2.1 of the Guidelines. The output string should use the following format:
SERVICE STATUS: information text
- Pipes (|) separate the description from the Perfdata.
-
Perfdata (Performance Data) is a series of name value pairs. These are described in section 2.6 of the Guidelines, but are generally a space-separated list with the following format:
'label'=value[UOM];[warn];[crit];[min];[max]
-
Example Return String
The Nagios check_load string returns the following load averages:
- Average over 1 minute
- Average over 5 minutes
-
Average over 15 minutes
When the plugin is invoked, it returns a response similar to the following:
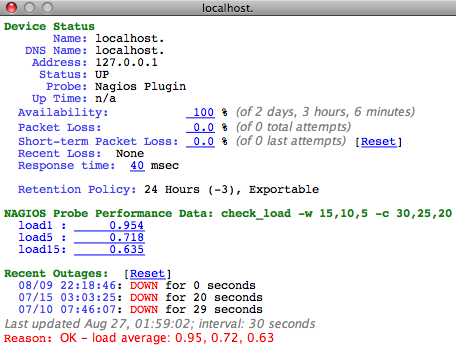
% ./check_load -w 15,10,5 -c  30,25,20
OK - load average: 0.95, 0.72,  0.64|load1=0.954;15.000;30.000;0; load5=0.718;10.000;25.000;0; load15=0.635;5.000;20.000;0;
Intermapper parses the plugin response line and uses the ${nagios_output} macro to produce a status window. For example,
For more information about Nagios, go to http://www.nagios.org. Nagios® and the Nagios logo are registered trademarks of Ethan Galstad.
Intermapper 5.0 Changes
For those familiar with the older Nagios Template probe, the new Nagios Plugin probe contains the following changes in behavior:
- The Nagios Template probe maps plugin exit code 2 as down. The Nagios Plugin probe maps plugin exit code 2 as critical, and plugin exit code of 3 as down.
- The Nagios Template probe takes anything written to stdout as the condition or reason for the status. The Nagios Plugin probe detects the presence of performance data (PERFDATA) (section 2.6 of the Guidelines) in the output, and makes a formatted and chartable display of the data.
- The canonical name of the Nagios probe has not changed. However, any device which used the old Nagios Template probe now automatically uses the Nagios Plugin probe.
An Intermapper probe automatically handles a Nagios plugin if it includes the
following:
- "flags" = "NAGIOS3" in the <header> section of the probe. See Probe File Header.
- ${nagios_output} in the <command-display> section of the probe. See Built-in Variables.