Chart Options
You can use the Chart Options window to view and edit the parameters that define a chart's appearance and content.
The Chart Options window is available from the Chart menu (Pg. 1). or by right-clicking within the chart window.
Applying Changes in the Chart Options Window
To apply changes to the Chart Options window:
- Click Apply to apply changes you have made on any of the tabs, without closing the Chart Options window.
- Click Cancel to undo any changes you made and applied.
- Click OK to apply any changes and close the window.
- Close the window to save your changes.
Setting the Chart Title
The chart title appears in the Charts menu and in the chart's title bar. Enter a title in the Title text box.
Vertical Axis Tab
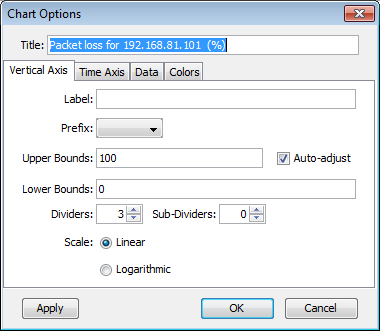
Vertical Axis Tab Parameters
- Label - Adds a label for the vertical axis of the chart.
- Prefix - Adds a prefix for the data displayed in the chart. Intermapper automatically scales the values to match this prefix, and inserts the prefix into the vertical axis label. For example, volts becomes µ-volts.
- Upper Bounds, Lower Bounds - Controls the vertical scale of the chart. Valid values depend on the monitored variable. NOTE: For larger values, use scientific E-notation. You can also enter these numbers in decimal notation (1000000, 1000000000). Larger numbers are displayed in the vertical axis in E-notation.
- To enter large values for the Upper or Lower Bounds, use the nnEp format, where nn = multiplicand, E = E-Notation, and p = power.
- To enter 1,000,000 (one million), type 1E6 (1 x 10^6).
- To enter 1,000,000,000 (one billion), type 1E9 (1 x 10^9).
- The largest unsigned 64-bit integer you can enter is just over 18.4E18 (18.4 x 10^18 or 18,446,744,073,709,551,615).
- The largest signed 64-bit integer you can enter is just over 9.22E18 (9.22 x 10^18 or 9,223,372,036,854,775,807).
- The largest negative signed 64-bit integer is -9.22E18 (-9.22 x 10^18 or -9,223,372,036,854,775,808).
- If you type e or E, it is rendered as E.
- Auto-adjust - Specifies if Intermapper automatically adjusts the scale of the chart. If the Auto-adjust check box is selected, the upper and/or lower bounds are adjusted automatically so data points are always displayed, no matter how much they increase or decrease.
- Dividers, Sub-Dividers
- Sets
the number of horizontal dividers and sub-dividers
that are displayed between the dividers.
For example, to divide a chart into 10 parts, you need eleven dividers. You can do this in one of the following ways:- Set the number of dividers to 11, with no sub-dividers.
- Set the number of dividers to 3, and the sub-dividers between each divider to 4.
- Scale - Select Linear or Logarithmic. When you select Logarithmic scaling,
you can set the Y-axis labels to powers of 10 by setting the desired upper
and lower bounds and adjusting the number of dividers to match.
A lower bound of 0 is converted to 1.
For example, to create a log scale with labels of 3000, 300, 30, and 3, do the following:- Set the upper bound to 3000.
- Set the lower bound to 3.
- Set the number of dividers to 4.
Time Axis Tab
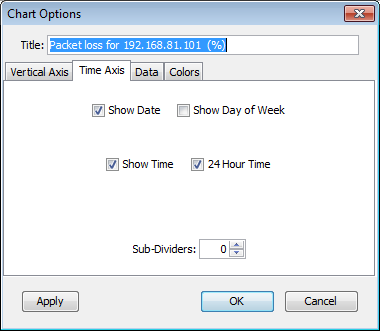
Time Axis Tab Parameters
- Show Date, Show Day of Week, Show Time, 24 Hour Time - Specifies which labels are displayed on a chart's horizontal axis.
- Sub-Dividers - Specifies the number of unlabeled vertical sub-dividers to draw between data points.
Data Tab
The Data tab displays a lists of datasets used in the current chart. Use the Data tab of the Chart Options window to export a dataset, to remove it from the chart, or to edit the appearance of a dataset legend.
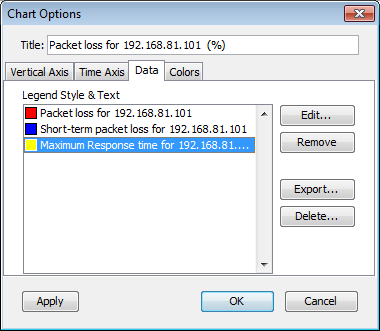
To remove a dataset from the chart:
- From the list of datasets, click the dataset you want to remove from the chart.
- Click Remove. The dataset disappears from the list.
To export a dataset:
- From the list of datasets, click the dataset you want to export.
- Click Export. A standard file dialog is displayed.
- Type a filename, select a location, and click Save. A tab-delimited text file is created, with one data value per line.
To edit the appearance of the legend for a dataset:
From the list of datasets, double-click the data for the set whose legend you want to edit. The edit window for the dataset legend is displayed:
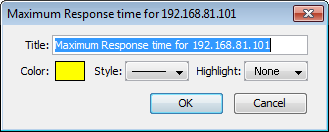
- Click the Color rectangle and choose a color for the dataset.
- Select a line style for the dataset from the Style menu.
- Select a highlight icon for the dataset from the Highlight menu.
- Edit the chart title in the Title text box.
- Click OK to save your changes.
To delete a range of data from a dataset:
- From the list of datasets, select the dataset containing the data you want to delete.
- Click Delete. The Delete Data window for the dataset
is displayed.
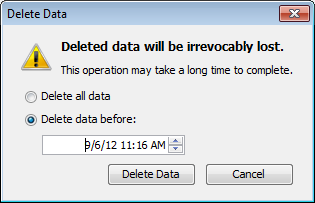
- Set the date and time. Data before this date and time are deleted from the dataset.
- Click OK. The data is deleted from the dataset.
Colors Tab
You can use the Colors tab of the Chart Options window to define the colors for various parts of the chart.
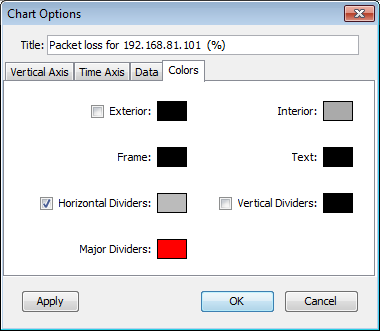
- Exterior - Sets the color of the chart's background.
- Interior - Sets the background color for the data area of the chart.
- Frame - Sets the line color for the frame of the data area.
- Text - Sets the color for the chart's text.
- Horizontal Dividers - Sets the line color for the chart's horizontal dividers.
- Vertical Dividers - Sets the line color for the chart's vertical dividers.
To change a color:
Select a color box. Use the system color picker to select a new color.