Selecting Source Data
When creating a report, you first need to specify which device or interface data to include in the report.
You can use the data source selection bar to select the devices or interfaces for your report.

To select data sources:
-
Click anywhere in the data source selection bar (shown above). A selection tree is displayed.
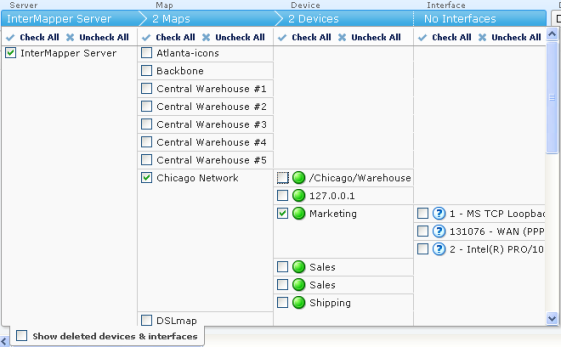
- Select or clear the check boxes for the devices or interfaces whose source data you want to include in the report.
- Select the Show deleted devices & interfaces check box to include devices or interfaces that have been deleted.
- Click Select All or Unselect All to select or unselect all devices or interfaces in a column.
-
Click the source selection bar. The selection tree is removed and the selected data is displayed.
NOTE:If you select a large amount of data over a large time range, it can take a few moments or longer for the data to appear. This depends on a number of variables such as the speed of reports server CPU, the amount of data, the selected time units.
Selecting a Dataset
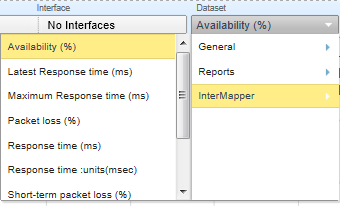
To create graphs, you need to select a dataset that contains numeric values. The datasets available depend on which devices are selected, the probes used to monitor those devices, what datasets are recorded through those probes, and whether those datasets are being exported to the Reports Server database.
A dataset is available when retention policy for the selected device is not set to None and one of the following is true:
- For devices, response time or short-term packet loss are always stored.
- For interfaces, incoming or outgoing bytes/second are always stored.
- If the dataset is specified in the probe to be 'autorecord' .
- If a chart is created from the dataset by clicking it in the Status window or dragging it from the Status window to an existing chart.
To select a dataset:
From the Dataset drop down menu, near the right of the device selection controls, choose a dataset. Assuming you are still in Table view, a list of values appears.
Selecting Data Grouping
Grouping by Time
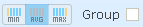
In most cases, the selected time scale causes each data point to represent a group of raw samples. Use the data grouping buttons to specify how you want the group of samples represented by a graph data point.
To select data grouping for each time period:
Do one of the following:
- Click Min to display the minimum value from the group of samples during a data point time period.
- Click Avg to take the average value from the group of samples during a data point time period.
- Click Max to display the maximum value from the group of samples during a data point time period.
Grouping by Device or Interface
When multiple devices or interfaces are selected, each device or interface's dataset appears as a line or bar on the graph. The Group check box allows you to group the datasets from multiple devices or interfaces into a single dataset that shows the minimum, average or maximum value for all devices in the group over the selected time period.
To view devices or interfaces as one dataset:
Select the Group check box.
Selecting Columns (Table view)
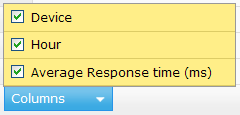
In Table view, regardless of the selected dataset, use the Columns selector to select which columns are displayed in the report.
Using the Page Controls
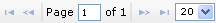
To select the page of data you want to view:
- Click the left and right arrow buttons to move to the start or end of the report or to move to the previous or next page.
- Type a page number to move to that page.
- Use the menu to specify the number of results are shown on a page.
Selecting a Data Range

You can limit the amount of data from the dataset that is displayed in the report. Using the Show Data From controls at the bottom of the window, select a data range, you select data over a time range and control the density of that data over the specified range. Select a range of data by date and specify the units (hours, days, weeks, months, and so on). For more information, see Data Range Options.
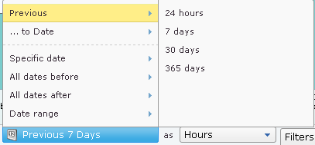
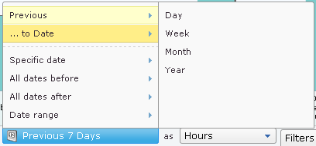
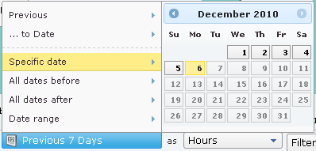
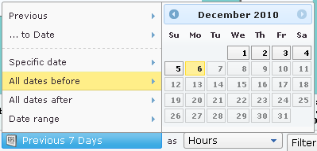
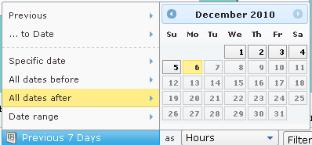
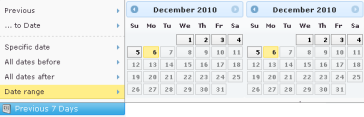
Data Range Options
|
Previous Select data from a range of time previous to today. |
|
|
to Date Select all data from beginning of the most recent day, week, month, or year. Time units vary with your selection. |
|
|
Specific date Select data for a specific date. |
|
|
All dates before Select all data before the specified date. |
|
|
All dates after Select all data after the specified date. |
|
|
Date Range Select data from the specified range of dates. |
|
Specifying Time Units
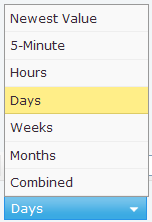
In addition to selecting a range of data over time, you can specify the units used to display the data.
Selected data units affect the time it takes to display the report. (Displaying data every 5 minutes over a year, for example, represents a large amount of data.)