Using the Monitor
The Monitor enables you to view current Jobs in the Scheduler and provides access to comprehensive Job management tools. Use the following steps to open and manage current Jobs.
Accessing the Monitor
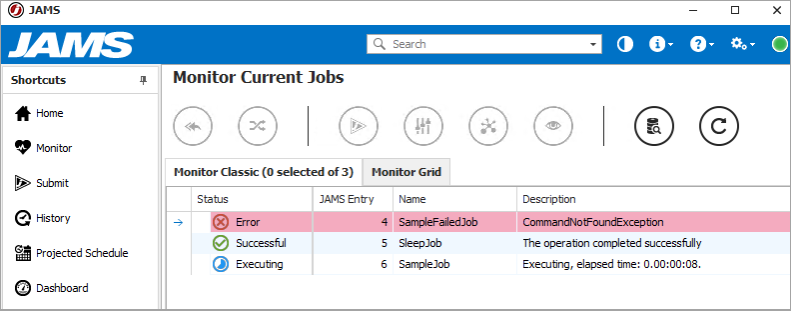
Click Monitor from the Shortcuts menu to open the Monitor Current Jobs view.

Customizing the Monitor View Using the Column Chooser
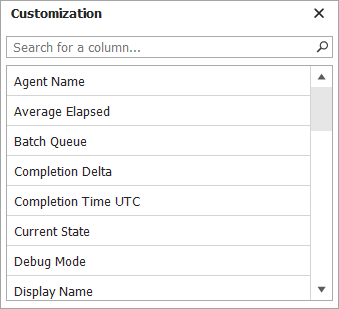
With the Column Chooser tool, you can add, remove, and move columns in the Monitor View, as well as the History and Folder Views. To use this tool, follow the steps below:
- Right-click on any column header and select the Column Chooser. The available columns are displayed in the Customization window.

- To add a column to the current View, drag and drop a column title to the left or right of an existing column.NOTE: Double-clicking a column title appends the new column to the right within the current View.
- To remove an existing column, drag-and-drop its header out of position until an “X” appears and then release the mouse button.
- To move any column, drag-and-drop the column header into the desired position within the current View.
Monitor View Options
With the Monitor view, you can view and manage Jobs, Sequences, and Workflows. The Monitor view provides buttons in the Control Bar at the top of the screen to do the following:
- Cancel - Cancel the selected Entry.
- Release - Release an Entry from one or more requirements that are preventing it from running.
- Hold - Put a manual hold on an Entry. The Entry will not start until the hold is manually released.
- Reschedule - Specify a new date and time to submit the selected Entry.
- Submit - Submit the selected Entry.
- Properties - View the Properties for the selected Entry.
- Show Detail - View the Monitor Detail dialog.
- Query - Select options to update the type of Entries that are displayed in the Monitor.
- Refresh - Update the list of entries that are displayed.
You can also right-click a Job, Sequence, or Workflow to access a menu that displays similar options as the buttons at the top of the screen. The displayed options will vary based on the type of Entry selected. For example, Sequences and Workflows have additional options for Show Sequence or Show Workflow to let you view the Sequence or Workflow tab within the Monitor Detail dialog. This allows you to easily view the selected Sequence or Workflow.
Querying the Monitor
Within the Monitor View, you can query and filter the Entries that are displayed, allowing you to customize the view.
- Open the Monitor view.
- Click the Query Button.
- On the Filters tab, select one or more of the following options:
- Automatically Add/Remove Entries
- Show Related Entries
- Show Executing
- Show Completed
- Show Pending
- Show Timed
- Show Only My Entries
- Click OK. The Monitor view is updated.
Monitor View Icons
Every Job contained in the Monitor view includes an icon showing the current state of each entry as listed in the table below.
| Icon | Description |
|---|---|
|
|
The Job completed with an Informational or Successful completion status. |
|
|
The Job is waiting on a dependency or the Job is held.
If it is a Workflow or Sequence Job, the icon indicates user input is required before it can continue. |
|
|
The Job completed with a Warning completion status. |
|
|
The Job failed with a Stalled, Error, or Fatal completion status. |
|
|
The Job is currently running, or it is a File Watch Job that executes indefinitely to poll for files that are used for triggers or dependencies. |
|
|
The Job completed with an Informational completion status. |
|
|
The Job is pending or it is waiting for its designated start time. |
Monitoring a Job
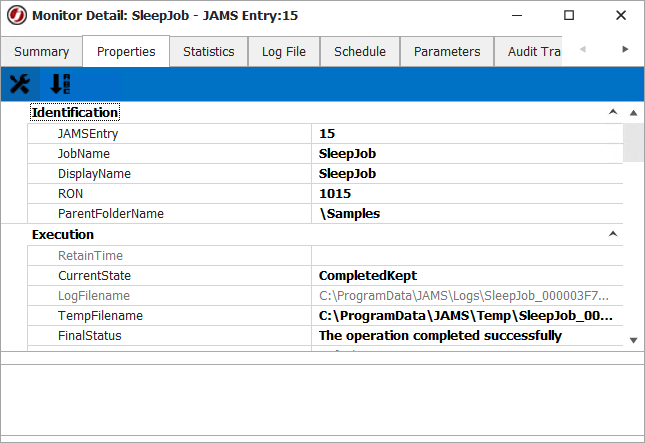
To monitor a Job currently in the Schedule, open the Monitor Detail dialog. To open this dialog, you can do one of the following:
- Right-click on a Job from the Monitor Current Jobs view and select Show Detail.
- Double-click the Job name.
- Select the Job and then click the Show Detail button in the Control Bar.

Each Job listed in the Scheduler displays the Properties as shown in the above screenshot.
Monitor Detail Tabs
The table below displays a description of the available tabs.
| Job Properties | Description |
|---|---|
| Summary | Displays Folder, Submit, and Job status information. |
| Properties | The Properties of the executing Job. |
| Statistics | Shows times, execution statistics, and related charts. |
| Log File | Lists all OS generated logs. |
| Schedule | The configured Items of the Executing Jobs. This tab also displays a Triggered By section to show the items that triggered this Job. This includes any option that is set in the Run this Job menu from the Schedule tab in a Job Definition. |
| Parameters | Details parameter names and values associated with the Job. |
| Audit Trail | Lists audit trail items for the Job, including message, comment, user name, local and UTC audit times. The Audit Trail shows changes to the state of the Job from the Monitor view, such as moving from Hold to Release. If the entry sends any notifications, they are listed in this Audit Trail. |
| History | Displays historical Job Execution information for the selected Job. |
| Documentation | The assembled documentation for the given Job and any Documentation inherited from parent folders. |
| Diagram | Displays a real-time diagram of the selected Entry that shows any upstream references, downstream references, and preconditions. The diagram displays the status of each Job/Entry. Only enabled Schedule Items are displayed. See Diagrams for more information. |
| Impacted Jobs |
Displays the list of Jobs that are waiting for the selected File Watch or Mail Watch Job to complete. These are created with a file trigger, mail trigger, or file dependency. Double-click a Job to view/modify its Schedule tab.
This tab is displayed for only File Watch or Mail Watch Jobs. |