Logging > Diagnostics
How to get there
From the Powertech Antivirus Navigation Pane, choose Logging > Diagnostics.
What It Does
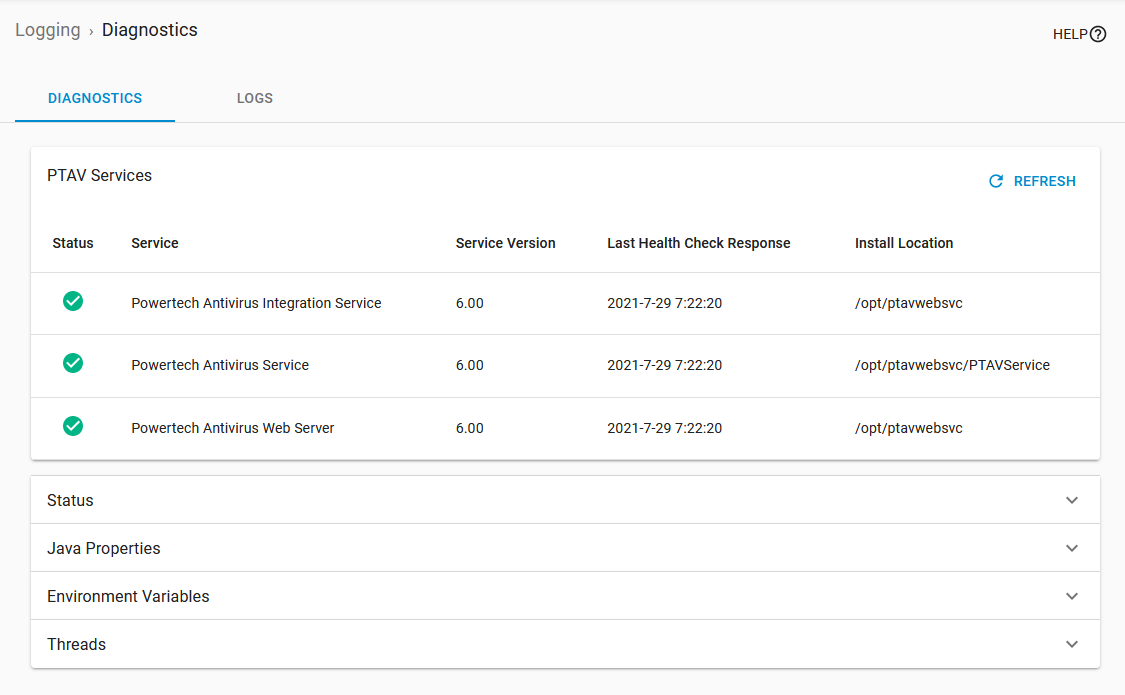
The Logging > Diagnostics page includes information helpful for diagnosing and troubleshooting potential issues.
This information is divided into the following sections:
- Status: Gives high-level system information (memory, date/time).
- Java Properties: Displays Java information and properties.
- Environment Variables: Displays your environment variables.
- Threads: Lists all used threads.
Identifying the Status of PTAV Services
![]() The service is active and functioning properly.
The service is active and functioning properly.
![]() The service is inactive.
The service is inactive.
Options
Diagnostics tab

Refreshes the page with the latest logging and diagnostic information.
Logs tab
Refresh
Reloads the display to show the most current log information.
Clear Log
Reloads the display with the log data removed.
Download Logs
Downloads the log data to your local machine in .zip format.
Choose Log
Allows you to choose between the two available log files, ptavws.log and hsconnect.log.
The ptavws.log includes all java related entries that would be found in hsconnect.log, in addition to any log output from the following projects:
- com.helpsystems
- org.springframework
- org.hibernate
- org.apache.kafka
- org.quartz
- net.sf.jasperreports
- org.apache.commons
These help diagnose issues related to the database, communication between services and endpoints, scheduling, reporting, and others.
The hsconnect.log includes only java related log output from the com.helpsystems.hsconnect project. These entries are focused on communication between services and endpoints.
 (Settings)
Opens the Logging Settings, where you can select the detail of the logging messages for Powertech Antivirus.