The Forensic Analysis area of Event Manager can be used to provide in-depth analysis of each event that has been recorded.
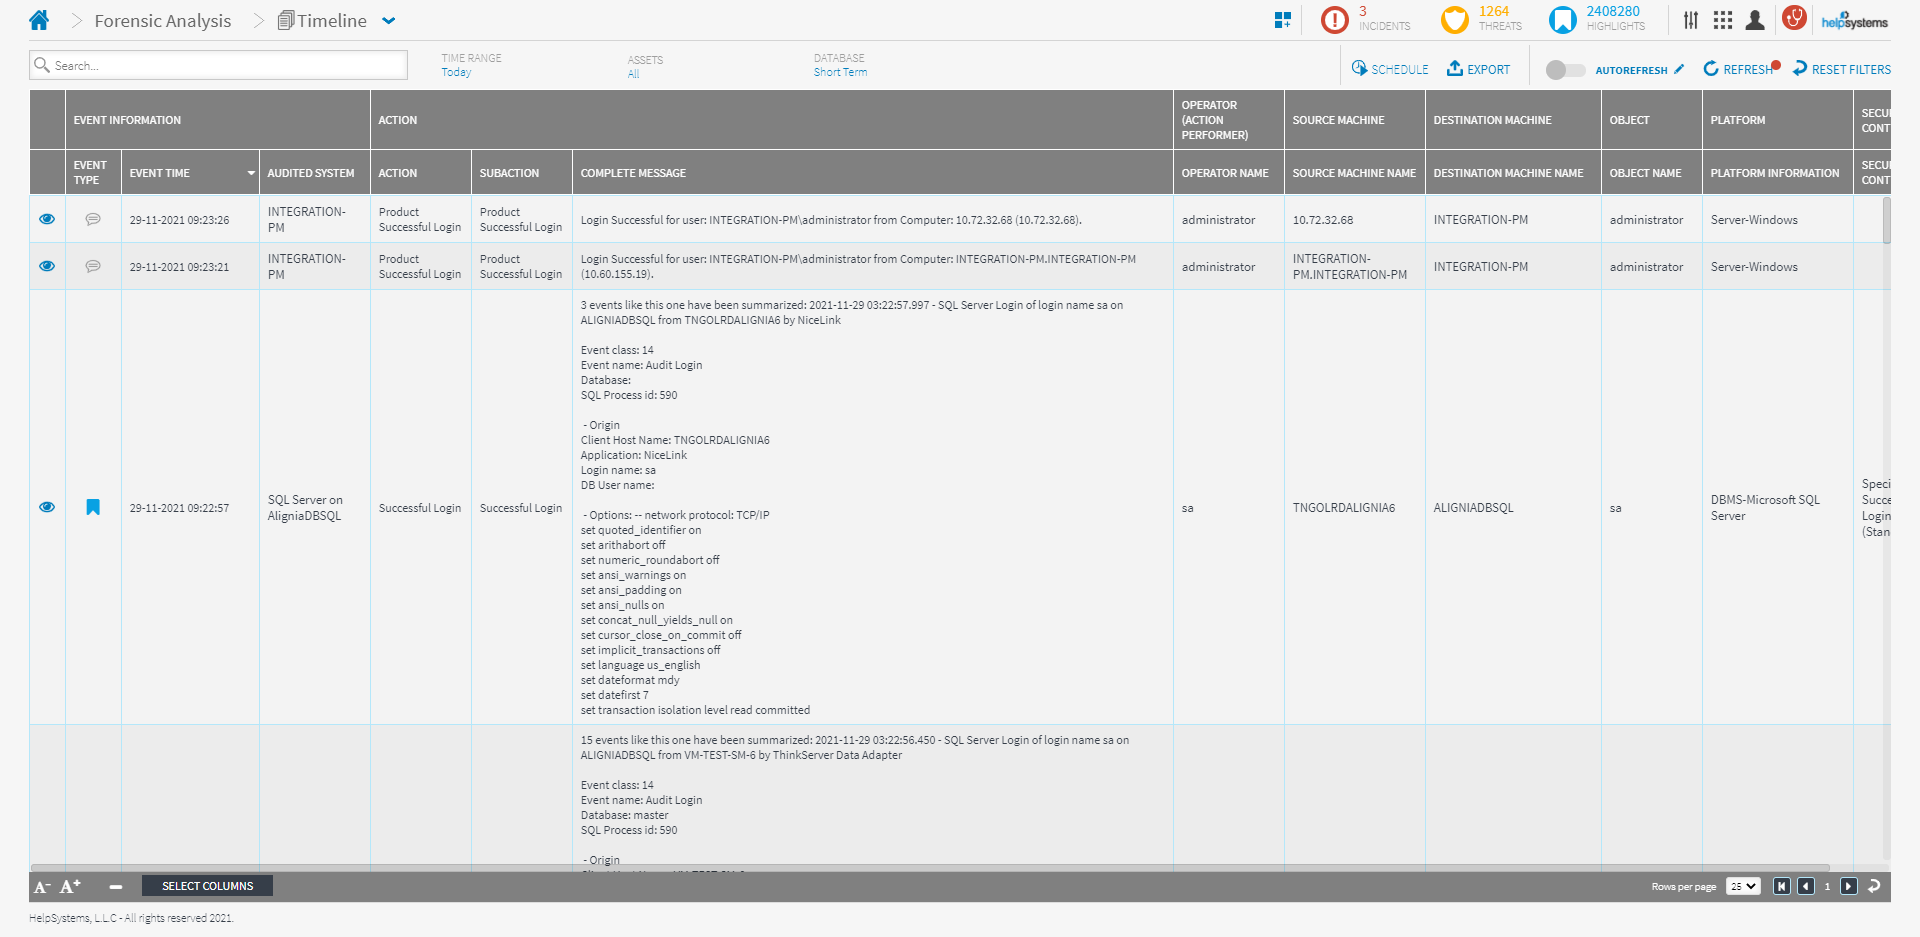
In the Forensic Analysis screen, ALL the collected events are displayed whereas the Event Manager only displays the controlled events (those that passed through a Security control and need a manual intervention).
Use the  down arrow in the header bar to select another display from:
The Forensic Analysis display is similar to the Event Manager main display.
Click on the ![]() View icon next to any event within the Forensic Analysis display to open a detailed breakdown of that event.
View icon next to any event within the Forensic Analysis display to open a detailed breakdown of that event.
The Overview tab is split into two panels.
-
Event Overview panel
-
Event Details panel
Event Summary panel
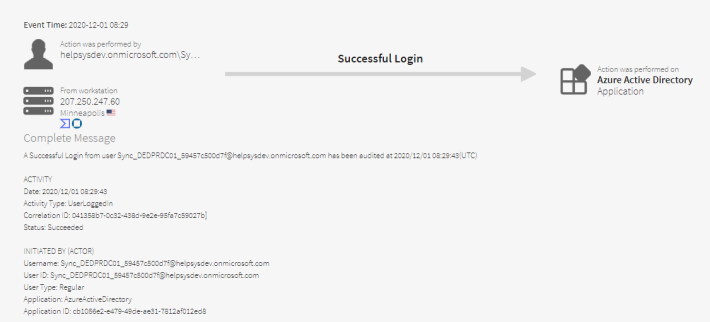
The Event Summary panel shows the drill-down details of the event.

The Event Summary typically shows the following information. Note that this is dependent on what has been configured for each asset:
Event time: The time at which the security event was logged.
Action was performed by: The user that performed the action
Event: The name of the event (written in bold above the directional arrow
Action was performed on: the name of the asset on which the event was performed
From workstation: The IP address of the workstation
Geo-Location: If from a remote device, the geographical location of the device together with the national flag of the country in which the device is located.
IP Address Reputation checks: For any event with an external IP Address, these checks enure that the IP address is reputable and not listed as an untrusted source. Click  to check the IP address reputation at virustotal.com or click
  to check at talosintelligence.com.
Complete Message: Full message raised by the security event
Activity: The date, time, type, correlation Id and status of the event.
Initiated By: The User Name, ID, Type, Application and Application ID
Authentication Details: The full authentication details of the Event
Audited on: The name of the asset on which the vent occurred and the current security criticality risk posed by the event.
Event Details panel
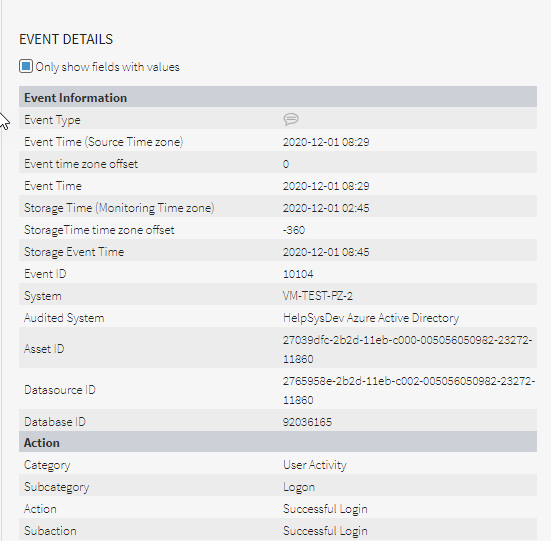
The Event Details panel shows a breakdown of every available field for which data can be captured for the selected event.
- Only show fields with values - Click to display just those fields for which a value has been registered rather than the list of every possible field.
Once the Analysis is complete, click Forensic Analysis in the header bar to return to the main Forensic Analysis display.
From this display, click Go to Event Manager, to return to the main Event Manager display.

