Event Manager Overview
Use the following displays and options to navigate through the Event Manager Overview display.
The Event Manager Overview menu bar
The Event Manager Overview contains a menu bar that provides access to configuration options and common functionality found within Event Manager.

Display Selection
Upon opening Event Manager, the default view is Overview. Use the  down arrow to select another display from:
Review Filtered Events
Click  Review Filtered Events to open Event Manager in Timeline view filtered to the active filters that are currently applied to the Overview.
Incidents, Threats, and Highlights Summary Totals
In the Event Manager menu bar, a summary of all the open incidents, threats and highlighted events is shown. This gives a quick, at-a-glance view of what is currently posing a security risk against your business assets.

The summary counts are taken from the events for each audit control against which an event has been logged.
Configuration
Click the  Configuration icon top open the Event Manager configuration options. These options are detailed in the Powertech Event Manager Configuration Guide.
Applications
Click the  Applications icon to display a drop-down menu displaying other Fortra applications such as Vityl IT & Business Monitoring and Insite. Click on an application to go to the selected option.
User Settings
Click the  User Settings icon to display a drop-down menu showing the name of the current user logged into this session. Also available from this display are the individual settings for this user and the option to sign out of the current session.

Showroom
Click the Showroom logo to go directly to the Event Manager options display.
Controls
The Controls setting can be used to limit the events displayed to those that just match a specific, defined Security Control. When selected, all the Security Controls that match the current filter are displayed.

Select one of the existing controls from those listed or type a new control on which to search into the Search box and press Enter or click  to initiate the search. Press OK to apply the security control filter to the Event Manager display.
 in the Search bar to display a list of search examples and Attributes that can be used to retrieve the required Security Controls.
 Reviewer
The Reviewer setting can be used to limit the events displayed to those that just match a specific, defined Reviewer or group of Reviewers. When selected, all the Security Controls that match the current filter are displayed. Click Reviewer to display a drop-down menu.

A selected reviewer is identified by a blue check box next to the name.
Use the vertical scroll bar to move through the list of defined reviewers or reviewer groups. Click in the associated check box to select a reviewer by which to filter the security events. Mutiple selections can be applied.
At the top of the drop-down menu is a search box. Start typing characters in this box to locate specific reviewers.
Click Select All to select all defined reviewers.
Click Clear to remove the selection from all currently selected Reviewers.
Once you have made the required selection click OK to apply the filter to the Event Manager Overview display.
Top to Display
By default, the top 5 events by Security Control and Reviewer are displayed in the Event Manager Overview. Use the up and down arrows to increase or decrease this value and amend the graphical display. Alternatively, you can over-type the current value with a new one.
Auto-refresh
Use the slider control to turn Auto-refresh on and off. When auto-refresh is enabled, the screen is automatically updated with new events at the set frequency. The default setting is 300 seconds. To change the frequency, click the  Frequency icon and enter a new time interval in seconds. The minimum value is 120 seconds.

Refresh
If Auto-refresh is not enabled, use the  Refresh button to update the Event Manager display with any security information that has been generated since the Event Manager option was reopened. Should a new event occur before the screen has been refreshed, a red dot appears above this icon to indicate that a new event has occurred and will be displayed on the next refresh.

Reset Filters
Use the  Reset Filters button to cancel any filter settings currently applied to the display and show all of the unfiltered events.
Graphical Summary
The Event Manager Overview contains a graphical summary of the Top 5 (or whatever value has been set) Security events by Control and by Reviewer.
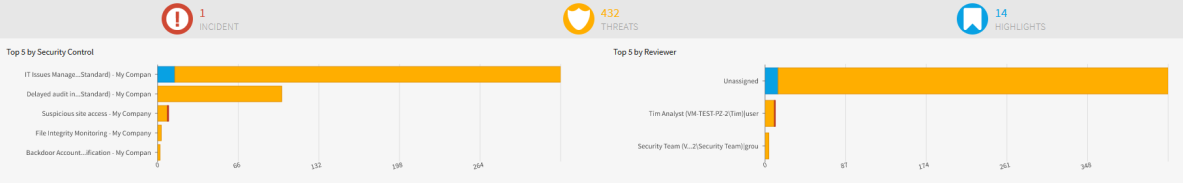
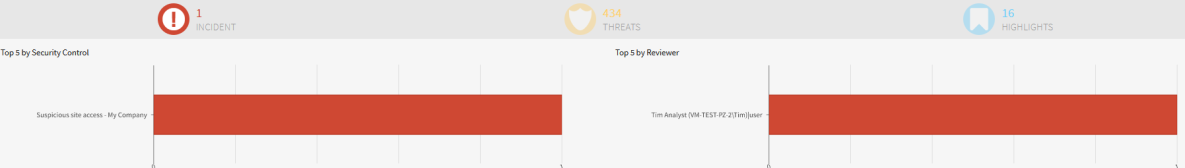
The top of the graphical displays the same Incidents, Threats and Highlights counts as those in the menu bar. However, clicking on any of these options here, filters the graphical display to just the selection.
For example, in the screen shot above, there is one incident recorded. Clicking on the Incident count value amends the graphical display as follows:
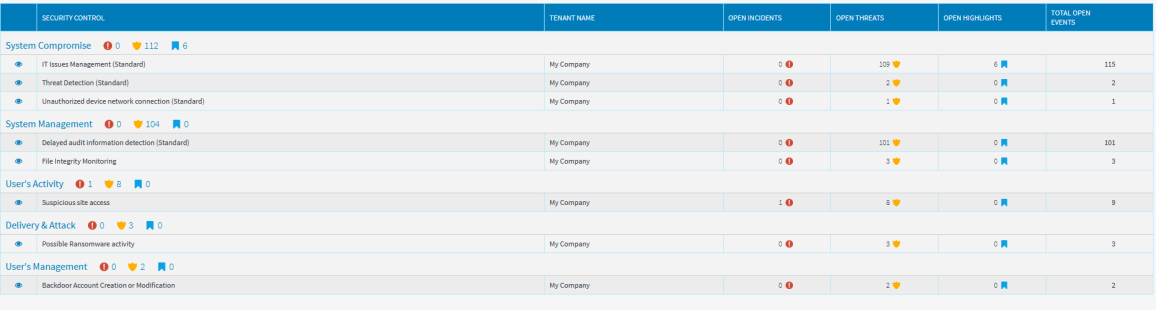
Security Controls Grid
The Security Controls Grid displays the current Security Controls, grouped by category.
Click on the name of the Security Control to amend the display in the graphical summary section of the Event Manager Overview.
Click the  View icon in the first column of this grid to open all the Security Events for the selected Security Control in the Event Manager - Timeline display.
Click on any of the column headings to be able to select the sort order from being either Ascending or Descending.
Screen shot
If, at any time you want to take a screen shot of the current Overview display, click the  Camera icon in the bottom right-hand corner of the display. You are then prompted whether to open or save the captured .png image.