Reports
Each of the Rapid Penetration Tests provides rich reports that can be used to consolidate, view and distribute your test findings as well as to plan ongoing prevention and remediation efforts. Reporting options are similar for each RPT and several reports are available for multiple RPTs.
- Types of Reports
- List of Available Reports
- Running Crystal Reports
- Running Spreadsheet Reports
- Creating User Spreadsheet Reports
- Running Reports from the Dashboard
For any report that consolidates data for more than one workspace, unique IP addresses and unique email addresses are treated differently for data summaries. For example, if the same IP address is discovered in 3 different workspaces, the report's Summary of Discovered Hosts will show a count of 3 hosts. Alternatively, if the same email address is reported in 3 different workspaces, the report's Summary of Targeted Users will show a count of 1 email address.
Types of Reports
- Crystal Report: This option uses SAP Crystal Reports as the engine to generate report data. Jump to Running Crystal Reports. Some reports are available only as Crystal Reports.
- Spreadsheet: Some Core Impact reports use Excel as the reporting engine. Check only the Spreadsheet checkbox to see which reports qualify. Jump to Running Spreadsheet Reports.
- User Spreadsheet: Any report that is available as a Spreadsheet report can be modified and customized to suit your specific business requirements. Once a report has been customized, it will be listed in the User Spreadsheet category. Jump to Creating User Spreadsheet Reports.
List of Available Reports
Available in the Network and Client Side RPTs, this is a detailed report about the hosts you tested using Core Impact, grouped by host IP address unless otherwise configured. Reported data includes:
- Number of compromised hosts
- Services and applications found on each host
- Average number of exploited vulnerabilities on those hosts
- The CVE names of the vulnerabilities found on each compromised host
- If available, a screen shot from the compromised host.
This report is closely linked to the Vulnerability report (see below). (For Network RPT and Client Side RPT only)
Customization options:
- Host Selection: You can select specific hosts on which to run the report, or report on all known hosts.
- Include host list grouped by services: Select this option to have the host data grouped by the services they were running.
- Include host list grouped by ports: Select this option to have the host data grouped by
- Include application list for each host: Select this option to include detected applications for each host in the report.
- Include closed ports for each host: Select this option to include detected closed ports for each host in the report.
- Black and white charts: Select this option to have charts created in black and white instead of in color.
Available in the General category, this is a report presents a summary of the penetration test conducted by Core Impact.
This report provides details about discovered identities harvested by brute force or post-exploitation actions. When executing up the report, you have the following options:
- Report format: Select either XLSX or PDF.
- Show hashes and passwords: Select either Yes or No.
This report details the exposures that were found during the Information Gathering stage of the RPT. Exposures are information that while not being a vulnerability might help an attacker to conduct information gathering activities. When executing up the report, you have the following options:
- Report format: Select either XLSX or PDF.
This report provides detailed information about hosts found and all vulnerabilities found that were successfully exploited. When executing up the report, you have the following options:
- Report format: Select either XLSX or PDF.
- Show hashes and passwords: Select either Yes or No.
This report provides detailed information about the vulnerabilities found, organized as a checklist to serve as a reference document for issues that need to be addressed. When executing up the report, you have the following options:
- Report format: Select either XLSX or PDF.
Available in the Network RPT, this is a report containing validation information for vulnerabilities imported from external vulnerability scanners. When executing the report, you have the following options:
- Report format: Select either XLSX or PDF.
Available in the Network RPT, this is a report containing validation and severity information for vulnerabilities imported from external vulnerability scanners.
Customization options:
- Host Selection: You can select specific hosts on which to run the report, or report on all known hosts.
- Black and white charts: Select this option to have charts created in black and white instead of in color.
Available in the Network RPT, this is report compares the Workspace's original results with those after remediation efforts have been performed.
Available in the Network RPT, this report provides detailed information about the video cameras found during the testing carried out by Core Impact and the risks and weaknesses associated to them
When executing the report, you have the following options:
- Report format: Select either XLSX or PDF.
Available in the Network, Client Side and WebApps RPTs, this is a detailed report about the vulnerabilities that were successfully exploited on each host (versus potential vulnerabilities). This report provides details for each of the exploited vulnerabilities listed for compromised hosts in the Host Report. Data includes Common Vulnerabilities and Exposure (CVE) as well as Common Vulnerability Scoring System (CVSS) details.
When executing the report, you have the following options:
- Report format: Select either XLSX or PDF.
Available in the Network RPT, this report indicates the amount of testing that was performed and shows which tests resulted in a vulnerability being found on the selected targets. When executing the report, you have the following options:
- Report format: Select either XLSX or PDF.
Available in the Client Side RPT, this is a detailed report of Client Side Penetration Tests including:
- Summary of client side attack types
- Email messages sent to deliver attacks or lure users to a malicious web site
- Exploits used in client side attacks
Customization options:
- Black and white charts: Select this option to have charts created in black and white instead of in color.
Available in the Client Side RPT, this is a detailed report of Client Side Phishing test results, including:
- Summary data of client side targets
- Percentage of targets who viewed the attack email
- Percentage of targets who visited the Phishing web site
- Percentage of targets who entered data into the Phishing web site
Customization options:
- Black and white charts: Select this option to have charts created in black and white instead of in color.
Available in the Client Side RPT, this is a detailed report about all the users that were discovered and targeted as a part of the penetration test.
Customization options:
- Black and white charts: Select this option to have charts created in black and white instead of in color.
Available in the Network RPT, this is a report showing all modules run for each detected host.
Customization options:
- Host Selection: You can select specific hosts on which to run the report, or report on all known hosts.
- Black and white charts: Select this option to have charts created in black and white instead of in color.
Available in the Network and Client Side RPTs, this is a report that shows a summary and detailed information of vulnerabilities exploited by Core Impact. This report is designed to comply with standards and requirements of the U.S. Government Federal Information Security Management Act (FISMA) and can help you achieve NIST SP 800-53A compliance.
Customization options:
- Black and white charts: Select this option to have charts created in black and white instead of in color.
- Show additional information for vulnerabilities: Select this option to include more details about vulnerabilities included in the report.
- Include identities: Select this option to include identities in the report output.
- Obfuscate plain text password: If including identities, check this option to mask any passwords.
- Group validated identities by: If including identities, identities will be grouped by Host or by Service.
Available in the Network, Client Side and WebApps RPTs, the Delta Report will show a side-by-side comparison of test statistics for any 2 workspaces.
Customization options:
-
Select 2 workspaces to compare.
A Trend report is a summary report which shows graphically the changes across 2 or more workspaces. This report is only available when Running Reports from the Dashboard.
Customization options:
- Timeline to be used in the report: Select the scale of the report as daily, weekly, monthly, quarterly, or yearly.
- Select attack categories to be included in the report: Select from Network, Client Side, and Web.
- Black and white charts: Select this option to have charts created in black and white instead of in color.
- Show numbers in charts: Select this option to have numbers visible on output chart.
Available in the Network, Client Side and WebApps RPTs, this is a summary report of all completed penetration test activities and their results. Reported data includes:
- Summary of exploited vulnerabilities
- Summary of discovered hosts and network devices
- Summary of targeted users
- Most exploited vulnerabilities (overall and by operating system)
Customization options:
- Black and white charts: Select this option to have charts created in black and white instead of in color.
The Network Executive Report is available as a Spreadsheet Report
Available in the Network, Client Side and WebApps RPTs, this is a detailed report of all modules executed in Core Impact, grouped by date/time run and module.
Customization options:
- Log detail level: select from Low, Medium or High.
- Include only parent level tasks: Select this option to prevent the report from showing details on sub-modules.
Available in the Network RPT, this report shows detail on all known wireless relationships that have been found while Testing a Wireless Environment. When executing the report, you have the following options:
- Report format: Select either XLSX or PDF.
Available in the Network RPT, this report provides a summary of information about attacks while Testing a Wireless Environment using a Fake Access Point.
Available in the Network RPT, this report shows data about results of Man In The Middle (MiTM) attacks.
Available in the WebApps RPT, this report summarizes the most relevant information obtained during the penetration test. This report includes information about discovered hosts, compromised vulnerabilities and executed tasks.
Customization options:
- Select how to show the exploited assets: select from Do not include, Most Exploited Web pages, List All Exploited Assets.
Available in the Client Side RPT, this report presents the results from the search of documents and any metadata within the discovered documents during Client Side Information Gathering. This report includes information about discovered hosts, compromised vulnerabilities and executed tasks.
Customization options:
- Show Sensitive Data: Check this option to include sensitive data in the report.
Available in the WebApps RPT, this report provides a comparison between the original data and the remediated results.
Available in the WebApps RPT, this report provides detailed information about all vulnerabilities that were successfully exploited during the penetration test.
Running Crystal Reports
To run a Crystal report:
- Click the Report Generation step for your RPT. The Report Generation wizard will open.
- Click Next to begin.
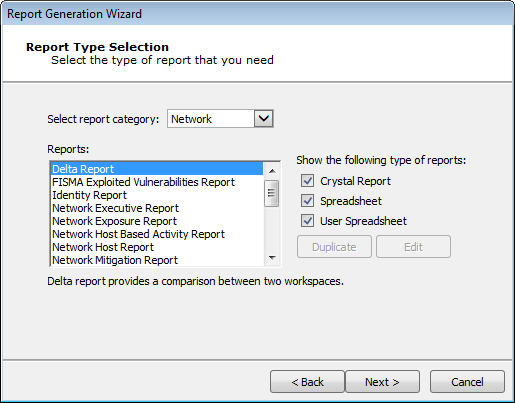
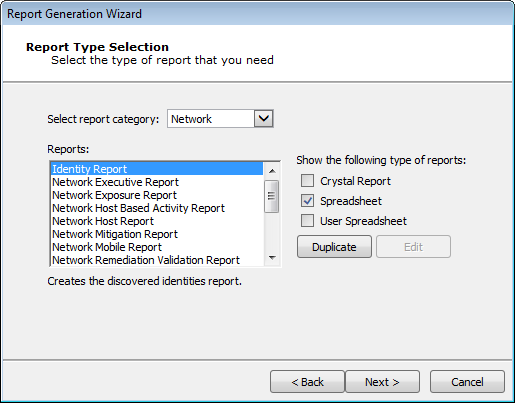
- Select the report category from the drop-down menu.
- Check only the Crystal Report check-box to display only the Crystal Reports. Select the Report that you wish to run and click the Next button. The report selections in the below image are from the Network Report Generation wizard; options will vary for other RPTs.
Report Type
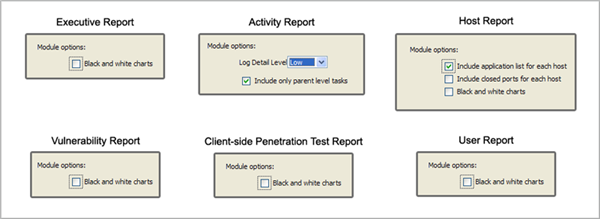
- Make any Report customizations that are available. Customizations will vary for the different report types.
Then click the Next button.
Client Side Report Customizations
- For WebApps RPT Reports only, click the ellipsis (
 ) button to choose the scenario(s) for which you would like a report. Then click the Next button.
 - For certain Network and Client Side RPT Reports, you must select the Workspace(s) for which you would like a report. On the Workspace Selection page, click the ellipsis () button to choose the workspace(s) for which the report should run.
- For any workspace that you want to include in the report, select it on the left (Available Workspaces) and click the Add button to move it to the Selected Workspaces pane. If you add a workspace that isn't the currently-opened workspace, you will be prompted for the workspace's password.
Workspace Selection
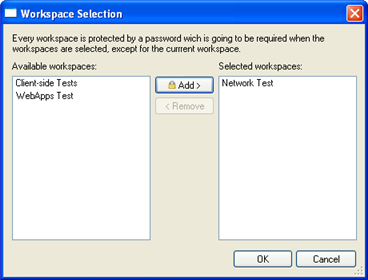
- Click the OK button to return to the Report Wizard.
- Click the Finish button to run the report.
The report will run and automatically display in the Crystal Reports Viewer Window. The following is an example of an Core Impact Host report displayed in the Crystal Reports Viewer Window:
Crystal Reports Viewer Window - Core Impact Host report Example
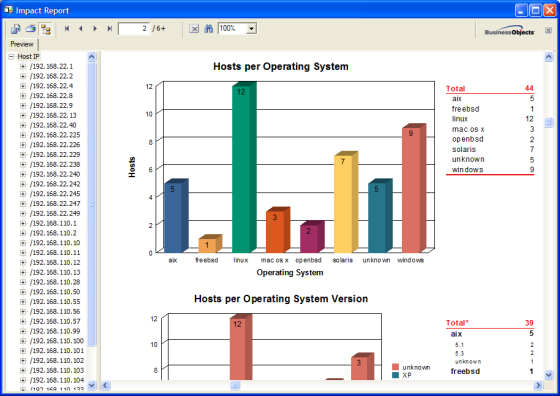
The main functionality for the Reports Viewer Window is provided by the Export Report, Print Report, and Toggle Group Tree buttons located on the top left corner of the window. Descriptions of each of these buttons are provided below.
 Toggle Group Tree
-
Allows you to collapse the Preview Pane for better individual report viewing/processing or expand it to select from available options (in this case host IPs). This feature is not available on the Client Side Penetration Test, User, or PCI Vulnerability Validation reports.
 Print Report
-
Allows you to print your report using the standard Windows Print Dialog Box.
 Export Report
-
Allows you to export your report to your chosen destination in your chosen document format.
If you are exporting your report, the Export Dialog Box will appear and you will be prompted to provide information on report format and destination, and then the export file location.
Report Generation - Export Dialog Box
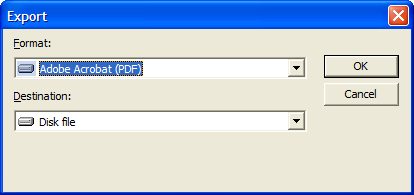
After you provide this information, the Export Records Dialog Box will appear and export your report.
Running Spreadsheet Reports
To run a Spreadsheet report:
- Click the Report Generation step for your RPT. The Report Generation wizard will open.
- Click Next to begin.
- Check only the Spreadsheet check-box to display those reports that can be generated as Spreadsheet reports.
- Select the desired Report and click the Next button.
Spreadsheet Reports
- Select the desired output format as either XLSX or PDF.
Then click the Finish button.
The report will run and automatically display in either Adobe Reader or Microsoft Excel, depending on the output format you selected.
Creating User Spreadsheet Reports
Any Spreadsheet report can be copied, then modified and customized to meet your specific business requirements. To create a User Spreadsheet report:
- Click the Report Generation step for your RPT. The Report Generation wizard will open.
- Click Next to begin.
- Check only the Spreadsheet checkbox to display only the Spreadsheet reports.
- Select the Report that you want to modify and click the Duplicate button.
Spreadsheet Reports
- The Report Source field will display the name of the report that you are copying. In the Report Name field, enter a new, unique name for your User Spreadsheet report. Optionally, enter a Description of the new report.
Spreadsheet Reports
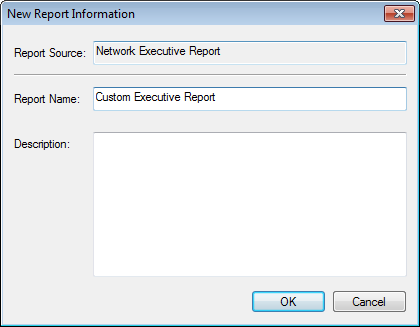
Then click the OK button.
- The report template will open in Microsoft Excel. Follow the below guidelines and examples for modifying the report template:
 Example: To Replace the Logo Image in the Template
- Click the Core Impact logo image in the Header area of the spreadsheet.
- Click the Picture button on the Excel toolbar.

- Microsoft Excel will present a pop-up message, stating that "Only one picture can be inserted in each section of the header". Click Replace.
- Browse to and select the image file that you want to use in the report template. Click Open.
- Save and close the Excel file.
When you subsequently run this custom report in Core Impact, it will contain your updated image in the header.
Example: To Add Columns from the Template Tables- Add a new worksheet to the Excel file and name the new worksheet (e.g. New Data). This worksheet will contain the data that you wish to display in the report.
- Right-click on any worksheet tab and select Unhide...
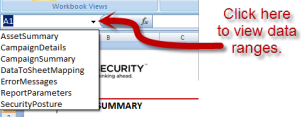
- The worksheets that are hidden by default are named with an underscore (e.g. _exp_data) and contain the raw data that the reporting worksheets reference. Select which raw data worksheet(s) you wish to unhide and click OK.
- On your new worksheet (New Data), create pivot tables or regular tables that references the data from the hidden worksheet(s). Do not reference explicit cells or columns. Instead, reference the Ranges that are included in the template.
- Right-click on the tab of any worksheet that should be hidden and select Hide.
- Save and close the Excel file.
When you subsequently run this custom report in Core Impact, it will contain your new worksheet and the resulting data from the table(s) you added.
Guidelines for Modifying Report TemplatesDO NOT
- Delete columns from the template. Use the Hide function in Excel to hide one or more columns from the template.
- Delete tabs from the template. Use the Hide function in Excel to hide one or more tabs from the template.
YOU MAY
- Change the logo image in the template.
- Rename columns
- Create new tabs that contain pivot tables, charts, etc. that reference the data in the report.
- When you are finished modifying the template, save and close the template file.
Your new User Spreadsheet can now be executed in the same was as the Spreadsheet Reports except you will find them in the User Spreadsheet category.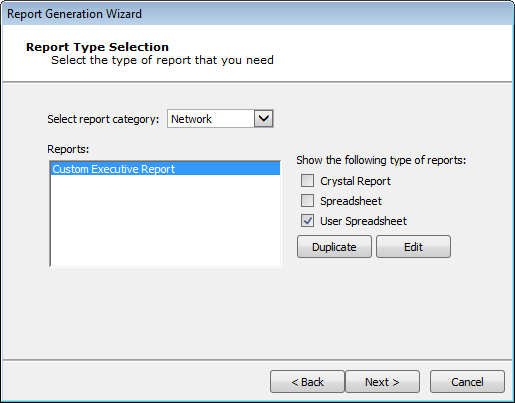
Running Reports from the Dashboard
Reports can also be executed from the Core Impact Dashboard which can be more convenient if you want to report on data across multiple workspaces.
- Click the Reports button
 .
.The Reports wizard will appear.
- Click the Next button.
- Select the Report Category from the drop-down menu as either General, Network, Client Side, or WebApps.
- Select the report you want to run, then click the Next button.
- If applicable, select the workspaces for which you want the report to run.
- If applicable, set any other customization options that are available.
- Click the Finish button.