Understand the Dashboard
The Dashboard is the Fortra VM homepage when you are logged in. It gives you an overall idea of your environment’s security posture.
Site header
The site header, located on every page, grants access to some primary Fortra VM features.
-
Business Group
All data and accessibility within Fortra VM is filtered according to the selected business group's parameters. Define custom business groups according to your organization's needs and switch between each here in the header. To setup business groups, see Business Groups.
-
Region
The header will display the engaged region for your Fortra VM product.
-
Notifications
Select the bell button
 in the header to see a display of notifications you received. The number of unread notifications will display with the envelope by a red number. To modify notification preferences, including email notifications, see Notifications.
 -
User Menu
When selected, the user menu in the header will open a menu for access to My profile, Manage Notifications, Change Password, Hide help, Report an issue, and Sign out.
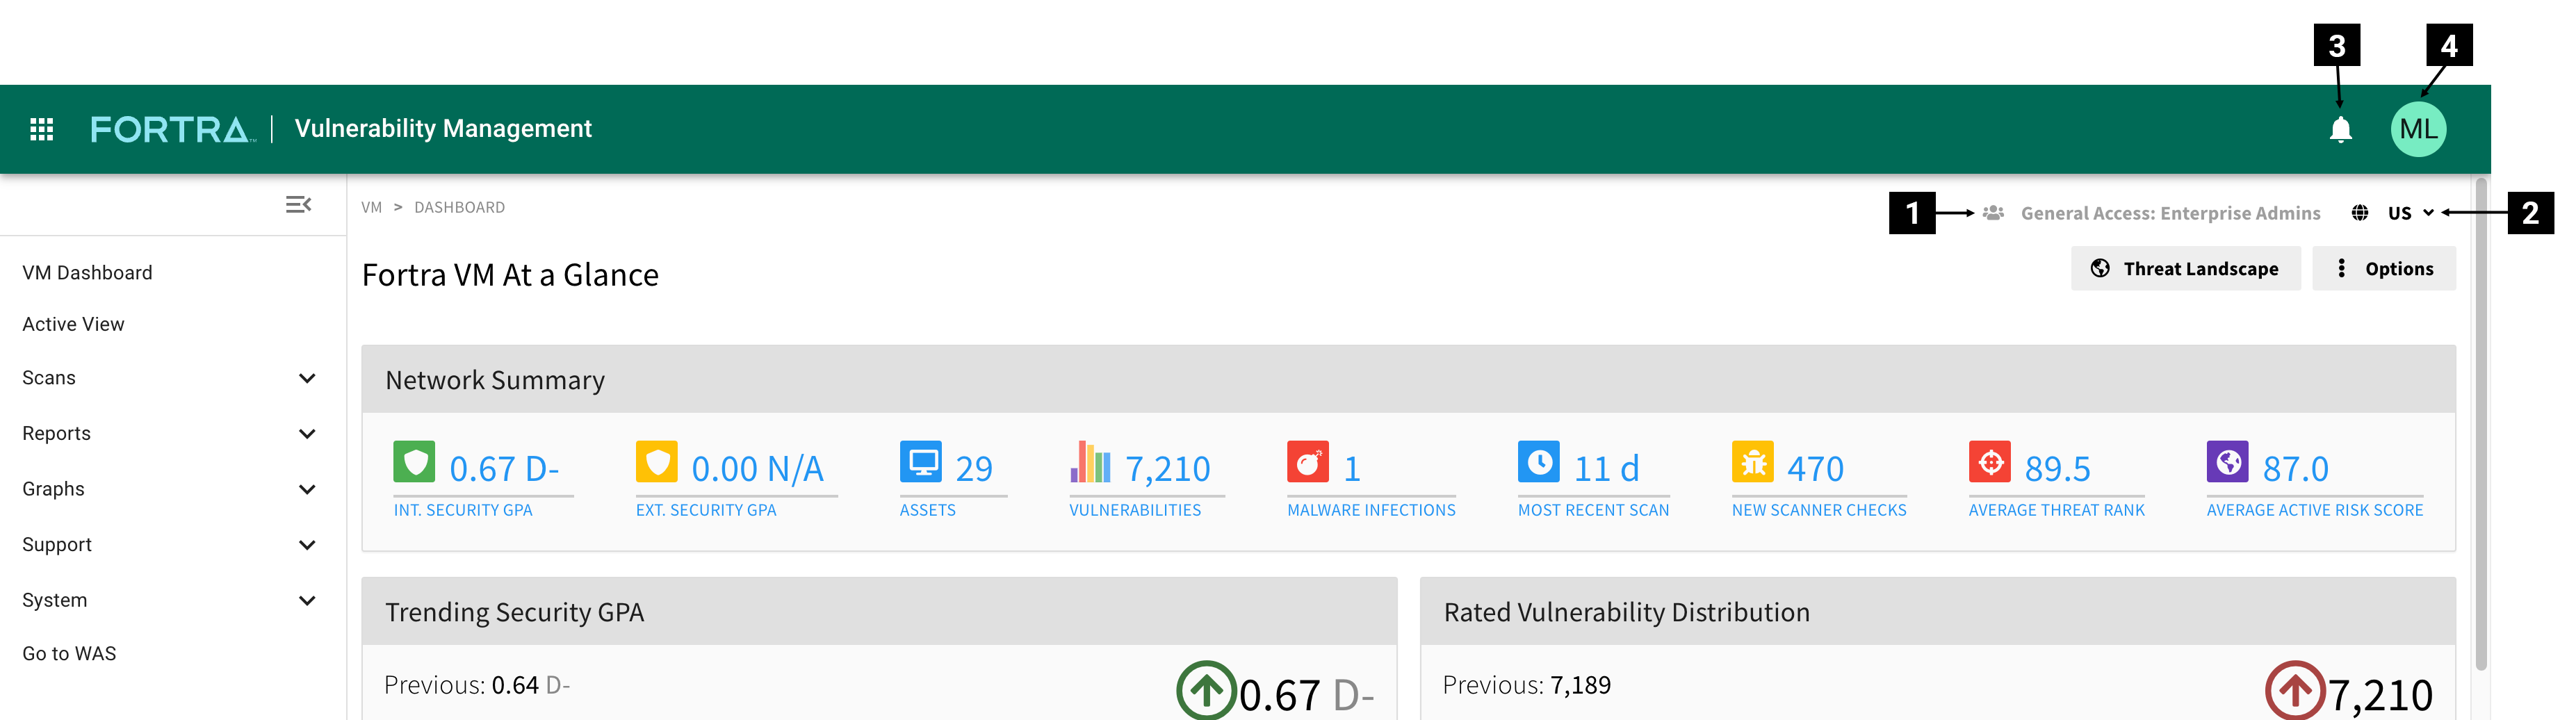
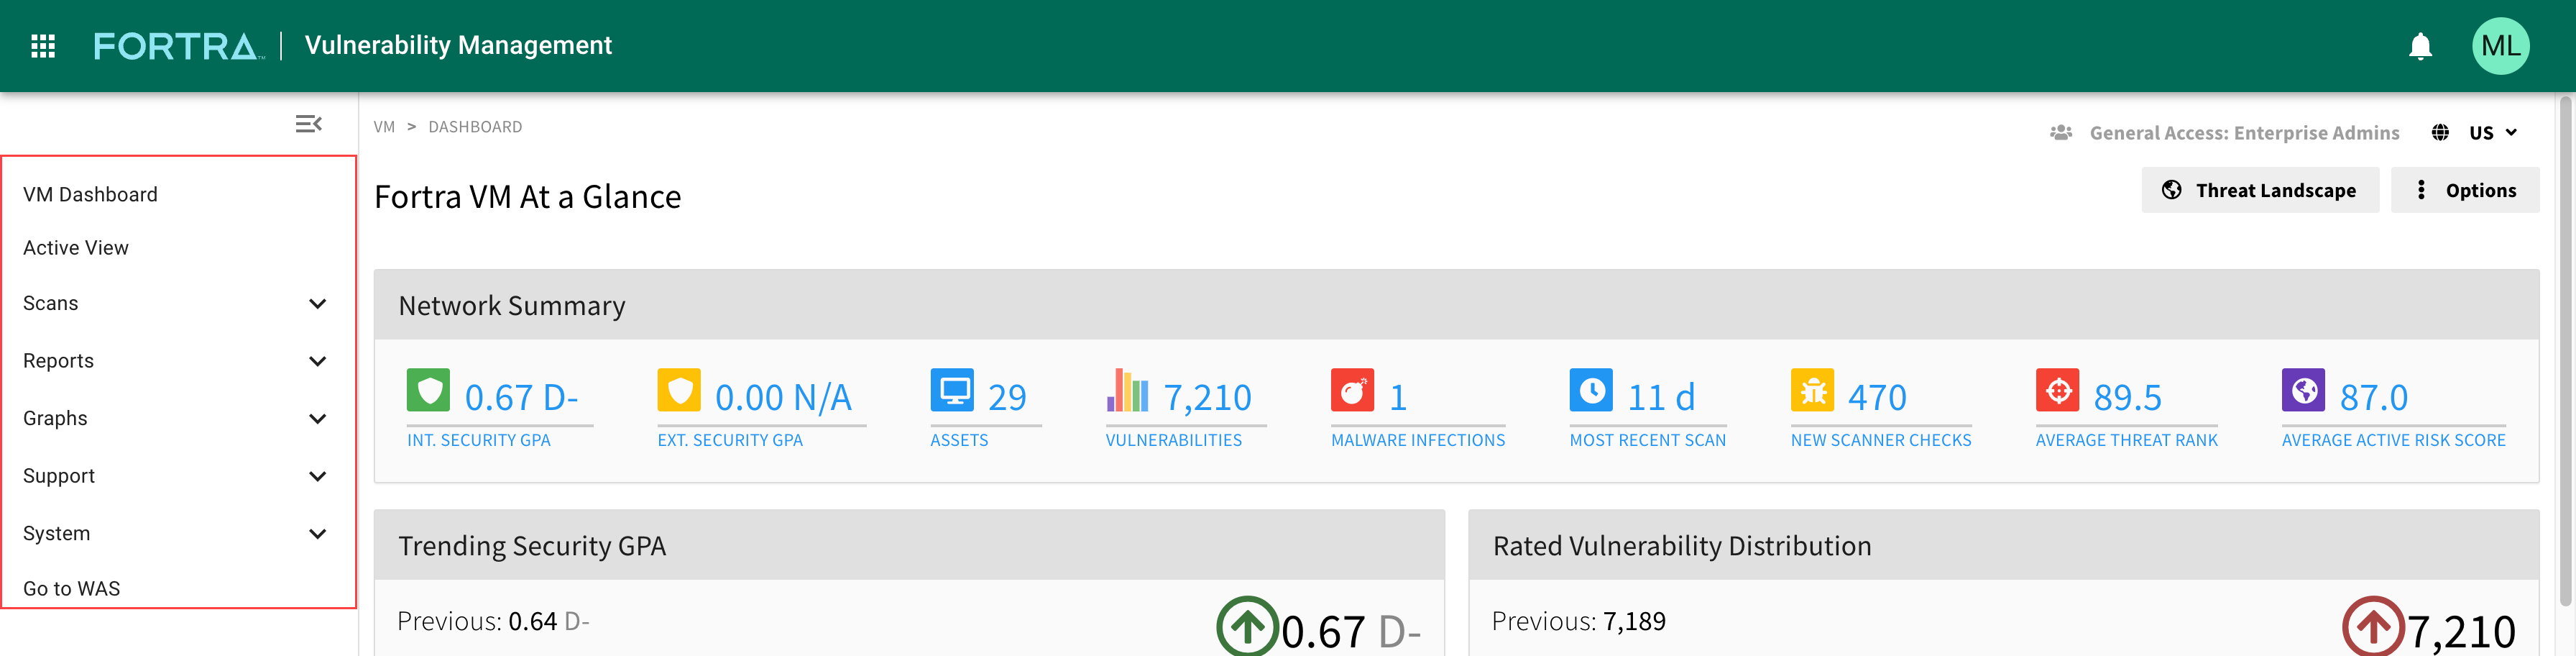
Navigation menu
The navigation menu, located on every page, gives you access to Fortra VM tools and features. Each item in the navigation menu will expand when selected to show additional options. The side navigation menu is your primary access point for all features within Fortra VM.
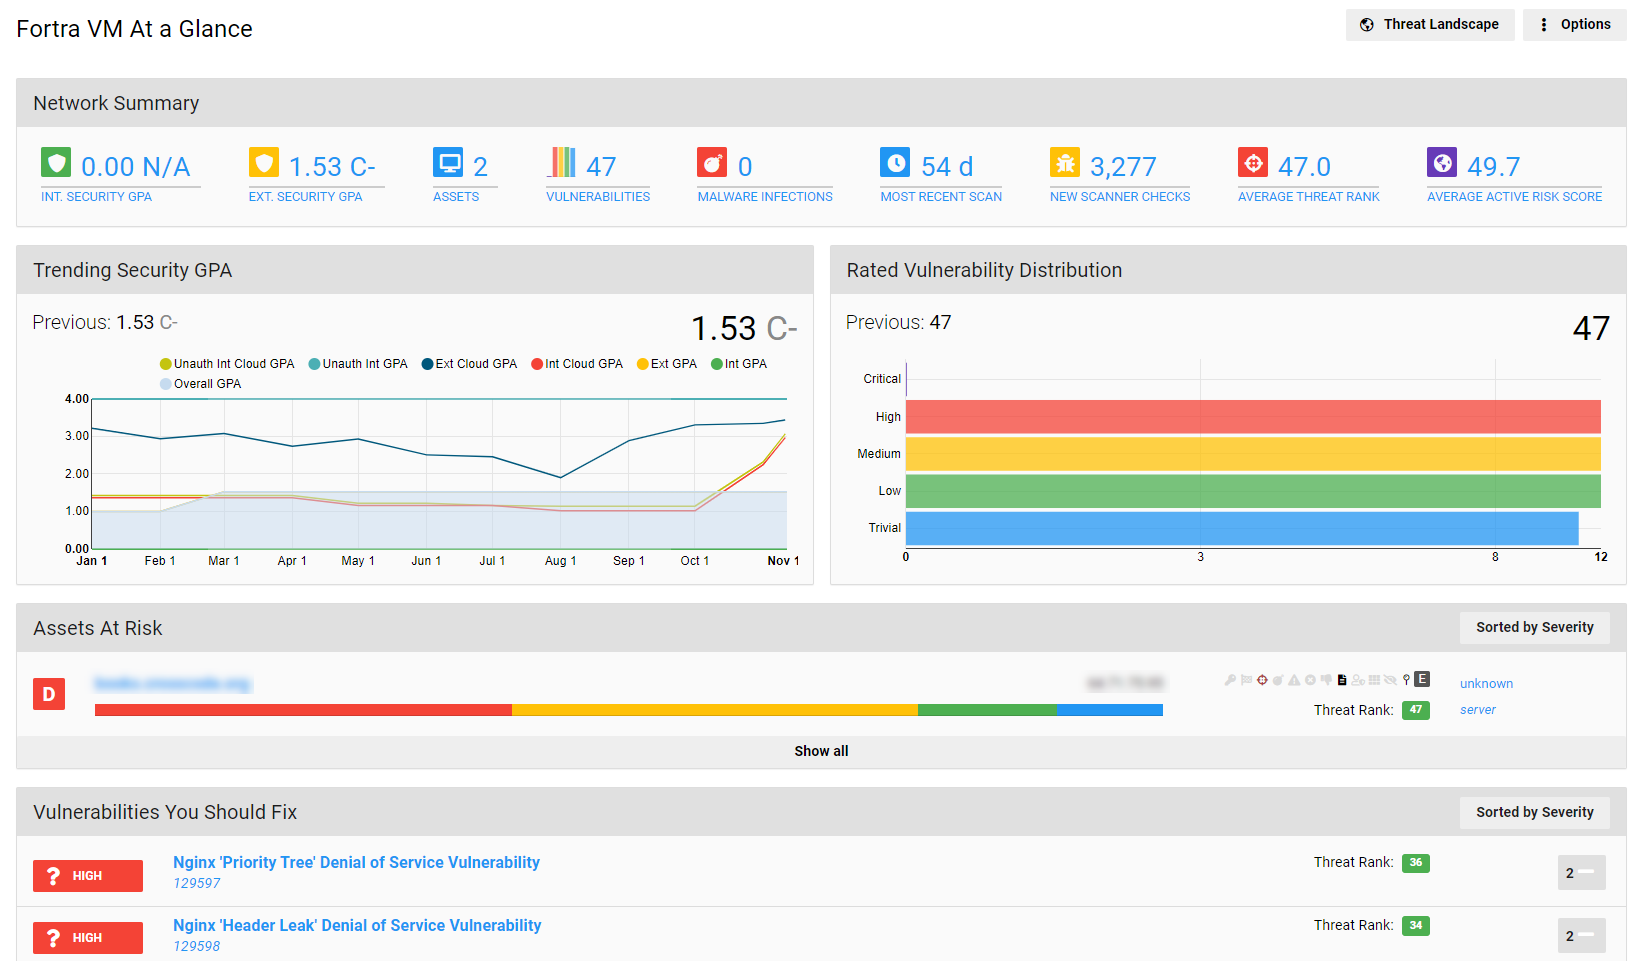
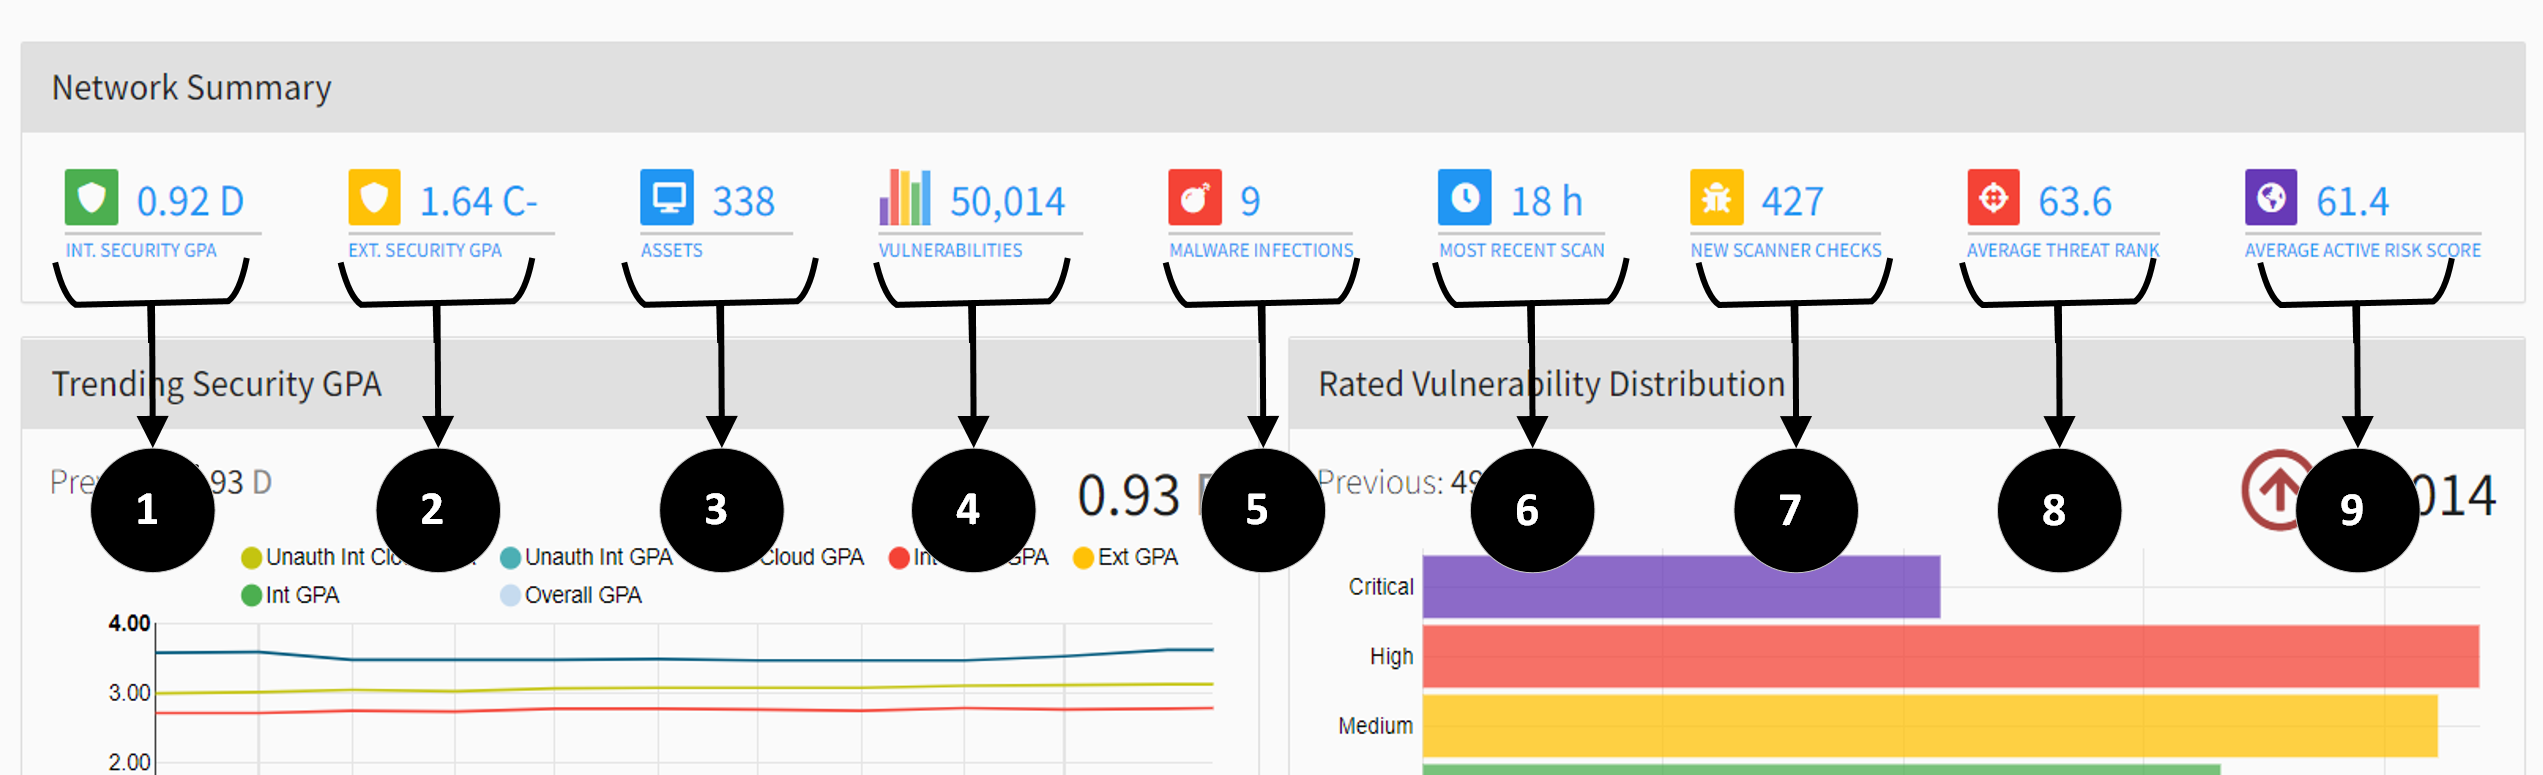
Network summary
The Dashboard's Network Summary panel provides an overview of the network’s security posture. You can select each item for direct routing to filtered data used to quantify the displayed scores.
-
Internal Security GPA
The weighted average of evaluated assets vulnerable to internal attacks (i.e., inside your network).
-
External Security GPA
The weighted average of evaluated assets vulnerable to external attacks (i.e., outside your network).
-
Assets
Evaluated assets identified in Fortra VM.
-
Vulnerabilities
The number of vulnerabilities discovered in your environment.
-
Malware Infections
The number of new malware infections identified from the last scan.
-
Most Recent Scan
Time elapsed since the last scan was preformed.
-
New Scanner Checks
The number of consolidated vulnerability checks (CVCs) newly added to the scanner.
-
Average Threat Rank
The average rank score attributed to the vulnerabilities found on your network. To learn more about Threat Rank, see Threat Rank.
-
Average Active Risk Score
The average of the Active Risk Scores of rated assets and vulnerabilities to define the actual risk exposure. See Active Risk Scores rate assets and vulnerabilities based on client-selected risk profiles to define actual risk exposure. for more details.
-
Security GPA
The weighted average of evaluated web applications vulnerable to attacks.
-
Web Apps
The number of evaluated web apps.
-
Vulnerabilities
The number of vulnerabilities discovered in your environment.
-
Most Recent Scan
Time since the completion of a previous scan.
-
New Scanner Checks
The number of consolidated vulnerability checks (CVCs) newly added to the scanner.
-
Allotted Web Apps
The number of web applications currently utilized and allotted on your subscription

Trending graphs
Trending graphs in the At a Glance dashboard provide additional data about vulnerability age and vulnerability remediation time trends. Only certain trend lines have been selected by default, and this is to highlight specific trends over others. Additionally, cloud statistics are now gathered and included in these graphs.
All Security GPA trending graphs have been modified to include a distinction between Security GPA generated from unauthenticated vulnerabilities only vs Security GPA generated from all vulnerabilities. This distinction extends to graphs in Fortra VM as well as PDF reports.
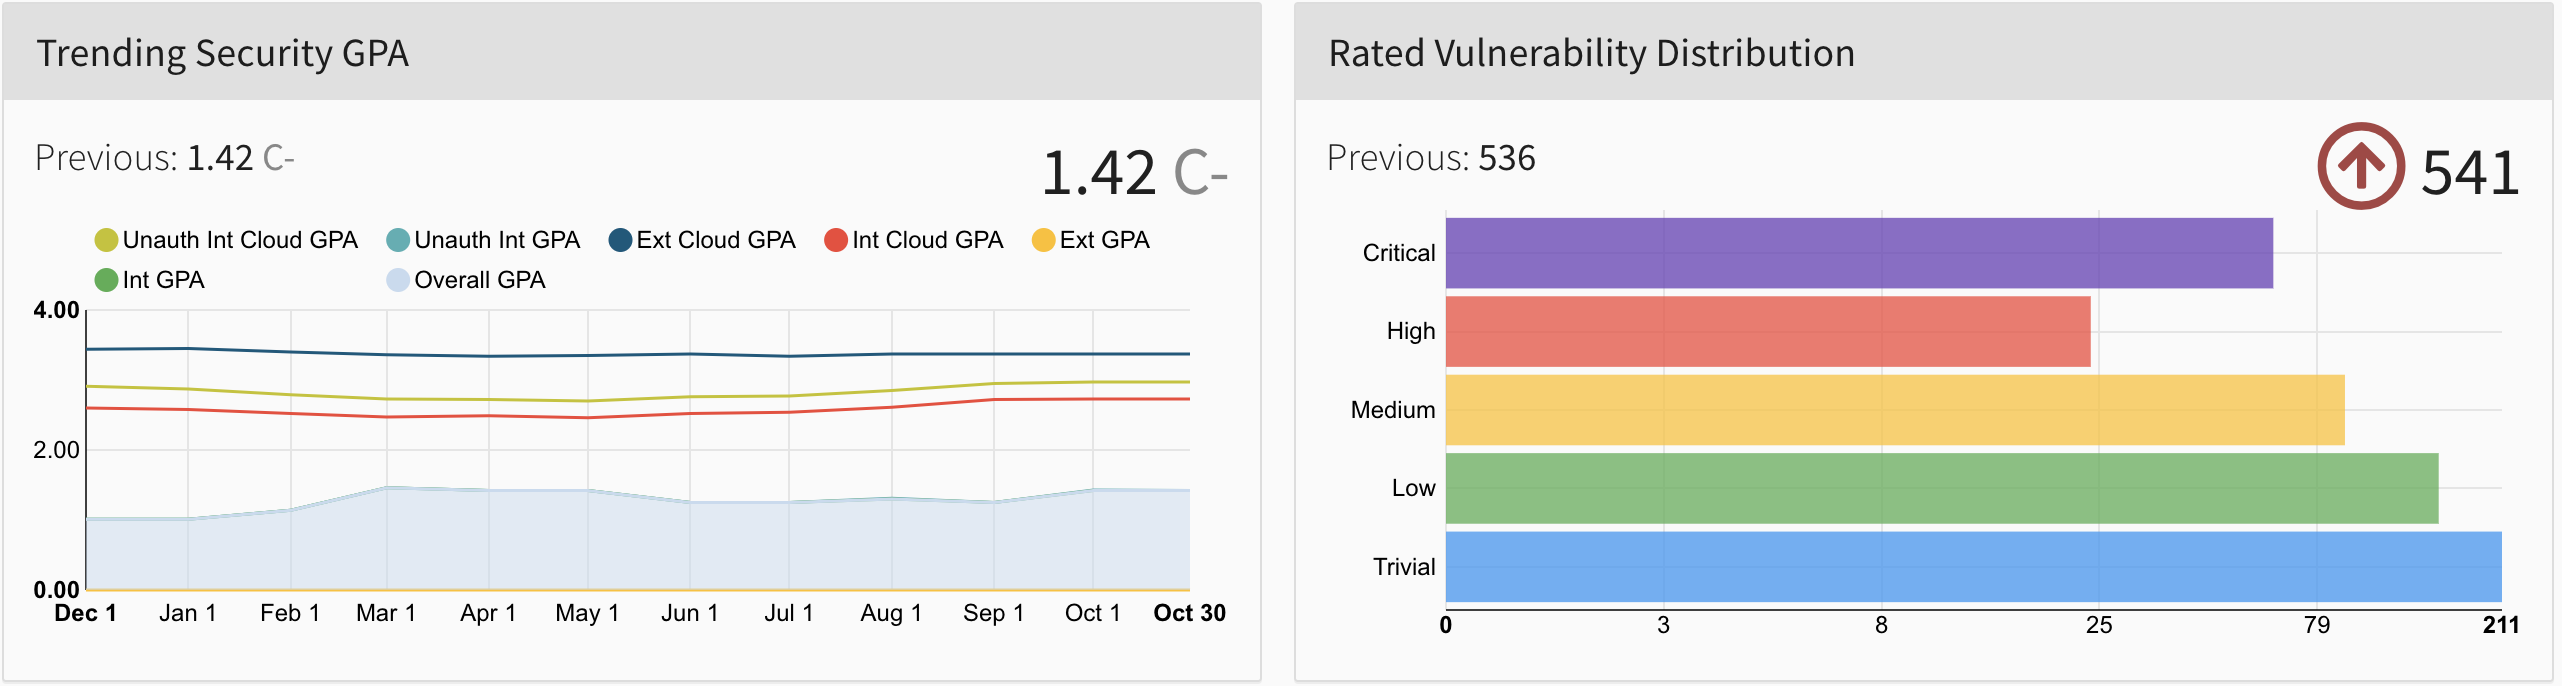
Trending Security GPA
The Trending Security GPA panel shows the progress in making your environment more secure.
-
Your Security GPA before the most recent scan.
-
The Security GPA following the most recent scan.
-
Data sets represented in lines on the trend graph. Each item can be designated to be shown or hidden based on your preference, select each title to show or hide on the graph.
NOTE: Cloud GPA is an anonymous and broad compilation of client data to help you evaluate how your data compares to other organizations. -
The graph helps you visualize you data progress over the past yea and how aspects of your network affect your organizations overall Security GPA.
TIP: Hover over a data point on the graph to see your exact score at a point in time.

Rated Vulnerability Distribution
The Rated Vulnerability Distribution shows you how severe the vulnerabilities in your environment are.
-
The number of vulnerabilities discovered in your environment before the most recent scan.
-
The number of vulnerabilities discovered in your environment following the most recent scan.
-
Vulnerabilities discovered in your environment categorized as follows:
-
Critical - Allows full system access and is easily exploitable.
-
High - Allows full system access but is not easily exploitable.
-
Medium - Allows some system access and partial control.
-
Low - Does not allow substantial system access but involved some information exposure.
-
Trivial - Tied to minor vulnerabilities but is not useful to an attacker.
TIP: To learn more about specific vulnerabilities, hover over, or select, the bar for the severity level you are interested in [e.g., Critical]. -

Assets At Risk
The Assets At Risk panel shows Fortra VM clients their top-five most vulnerable assets which can be sorted by Severity or by Threat Rank.
-
Asset's Security GPA
-
Asset Name - Select to view vulnerabilities found on this asset.
-
Bar graph of severity levels of an asset's vulnerabilities
TIP: Hover to see specific data sets (for example, number of medium vulnerabilities on asset). -
Asset IP address
-
Asset status icons - Hover over each one for a description.
-
Asset operating system and type

In WAS, the At-Risk Applications panel shows your top-five most vulnerable web applications.
-
Web application's Security GPA
-
We application's name - Select to view this web application's specific vulnerabilities
-
Bar graph displays the severity levels of a web application's vulnerabilities - Hover for specific data set information.
-
Web application's status.
Vulnerabilities You Should Fix
The Vulnerabilities You Should Fix panel shows the vulnerabilities that most need your attention. These can be sorted by Severity or Threat Rank.
-
Vulnerability class and severity level:
-
Explicit
-
Potential
-
Recon
-
Compliance
-
Malware
For more details, see What are vulnerability classes and severities?
-
-
Vulnerability description
-
Vulnerability instance on your environment

Recent Scanner Releases
The Recent Scanner Releases panel provides information about Network Scanner

Recent Fortra VM Releases
The Recent Releases panel provides information about Fortra VM releases, including release notes.
