Debug Panel - Breakpoints |
Breakpoints provide a means of pausing execution at a specified step in order for developers to inspect certain aspects of the task. In the Steps panel, breakpoints are designated by a red, circled icon located on the left side of the step number. The Breakpoints debug panel is used for viewing and managing breakpoints. It lists the step number and textual description of any step that contains a breakpoint. Using this debug panel, you can easily jump to any breakpoint step, remove a specific breakpoint or remove all breakpoints.
The Breakpoints debug panel includes the following fields (columns).
Column Header |
Description |
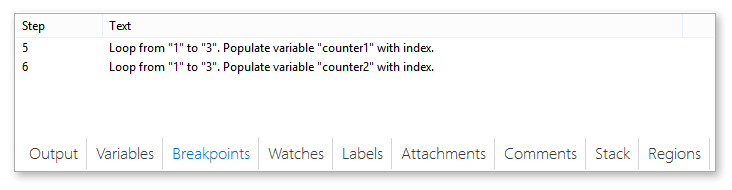
Step |
The step number where the breakpoint resides. |
Text |
The textual description of the action where the breakpoint resides. |
Right-clicking inside the Breakpoints panel opens a context menu with the following items:
Menu Item |
Description |
Jump To |
Jumps to the particular step in the Steps panel where a breakpoint resides. |
Remove |
Removes the selected breakpoint(s). To select multiple breakpoints, hold down CTRL during selection. |
Remove All |
Removes all breakpoints contained in the task. |