Robot Reports Report Sets History Dashboard Widget
For systems that have Robot Reports installed, this widget displays the report history over a period of time and whether any reports are ready to be bundled or deleted. You can choose a single metric Robot Reports to view in each widget. Add additional widgets to view several metrics at the same time. The available metrics are:
-
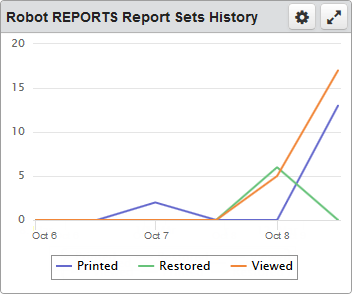
Access History: Shows the number of reports being accessed. Viewed, printed, and restored reports are each shown separately.
-
Processing History: Shows the number of reports processed during the period and those that are still processing.
-
Archive Status: Shows the number of reports that have been archived. Separate totals are shown for those archived online, archived to short term storage, and archived to long term storage.
-
Waiting to be Deleted: Shows the number of reports that are ready to be deleted.
-
Ready to be Bundled: Shows the number of reports that are ready to be bundled.
See the Robot Reports User Guide for detailed information on reports and report sets.
Things you can do:
ClickTap  Maximize to view the widget full-screen. ClickTap
  X to view it on the dashboard again.
If the data is in a graph:
-
Hover your mouse overTouch and hold the lines to view information about the data points.
-
ClickTap any item in the legend to hide or show its data in the graph.
-
ClickTouch and drag over an area of the graph to zoom in or out.
To change the settings:
-
ClickTap
 Settings on the widget.
 -
Type a new Name, if necessary.
-
ClickTap Reset Name to have the software create a name based on the widget and the settings you've selected.
Note: If you change any of the settings on this page and you're using the system-generated widget name, be sure to click Reset Name before saving your changes.
-
Select the display Size of the widget on the dashboard. This affects the height of the widget.
-
ClickTap the Auto-Refresh button to enable it (Yes) or disable it (No).
-
Type the number of minutes between each Auto-Refresh (Mins).
Note: If a dashboard is displayed and you step away from your screen, as long as the time you enter here is less than what the Robot Network for Insite administrator enters for the Session Timeout, your session will not time out.
-
ClickTap Look Up to select the Product Metric you want displayed. See the beginning of this section for a description of each metric.
-
Select Graph or Table for the data display.
-
Select the Data Range for the data.
-
Select the Systems to display.
If you select Host, Node, or Node Group, clicktap Look Up to select the systems you want.
-
ClickTap Save.
Note: ClickTap Delete to delete this widget from the dashboard.