Robot Schedule Jobs History Dashboard Widget
For systems that have Robot Schedule installed, this widget displays information about jobs over a period of time. You choose a single metric to view in each widget. Add additional widgets to view other metrics at the same time. The available metrics are:
-
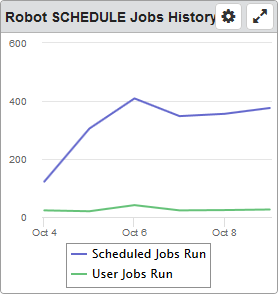
User vs. Scheduled: Shows the number of jobs that were manually submitted and the number of jobs that were submitted by Robot Schedule.
-
Jobs by Completion Status: Shows the number of jobs that completed normally, abnormally, and ended in error (have a status of E). Note: An E status in Robot Schedule usually means there was an error on submit as a result of the job setup.
-
Jobs with Warnings: Shows the number of jobs that have run and the number with warnings.
-
Job Monitor Events: Shows the number of jobs that started late (late start), ran too long (overrun), or ended too early (underrun).
See the Robot Schedule User Guide for detailed information on jobs.
Things you can do:
ClickTap  Maximize to view the widget full-screen. ClickTap
  X to view it on the dashboard again.
If the data is in a graph:
-
Hover your mouse overTouch and hold the lines to view information about the data points.
-
ClickTap any item in the legend to hide or show its data in the graph.
-
ClickTouch and drag over an area of the graph to zoom in or out.
To change the settings:
-
ClickTap
 Settings on the widget.
 -
Type a new Name, if necessary.
-
ClickTap Reset Name to have the software create a name based on the widget and the settings you've selected.
Note: If you change any of the settings on this page and you're using the system-generated widget name, be sure to click Reset Name before saving your changes.
-
Select the display Size of the widget on the dashboard. This affects the height of the widget.
-
ClickTap the Auto-Refresh button to enable it (Yes) or disable it (No).
-
Type the number of minutes between each Auto-Refresh (Mins).
Note: If a dashboard is displayed and you step away from your screen, as long as the time you enter here is less than what the Robot Network for Insite administrator enters for the Session Timeout, your session will not time out.
-
ClickTap Look Up to select the Product Metric you want displayed. See the beginning of this section for a description of each metric.
-
Select Graph or Table for the data display.
-
Select the Data Range for the data.
-
Select the Systems to display.
If you select Host, Node, or Node Group, clicktap Look Up to select the systems you want.
-
ClickTap Save.
Note: ClickTap Delete to delete this widget from the dashboard.