Diagnostics
Use the Diagnostics section of the Node Properties page to troubleshoot network problems with the node.
In the Navigation Pane, clicktap My Network under the Robot Network menu. If the menu is hidden, hover over the Navigation Pane to expand it. Then, clicktap  Show Actions next to the node you want to view and select Node Properties.
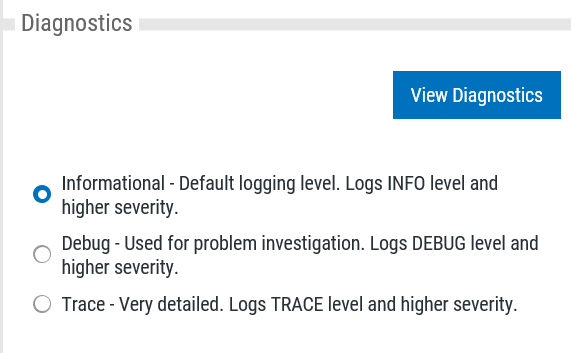
Select which logging level you want for the node: Informational, Debug, or Trace.
Note: The logging levels go from the least detailed (Informational) to the most detailed (Trace).
If directed by Technical Support, you can also clicktap the View Diagnostics button to display diagnostic information about the host and its nodes in a new browser window.