Top Hosts Tab
Click the Top Hosts tab (or type Ctrl-1) to view a list of top talkers, listeners, or both, with stack and pie charts showing the relative activity of each.
Stack Chart
You can use the Stack chart in the Top Hosts tab to view the relative activity of different hosts over time. Each host's activity is stacked with the others, with the top host on the bottom of the stack. Here's a typical stack chart:
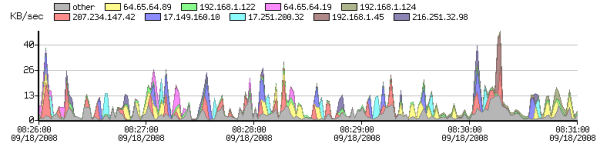
The legend above the chart shows the top hosts for the data you are currently viewing.
- Click a legend (above the stack chart) to select the corresponding line in the Host list.
- Mouse over an area of the stack chart to view the host address for that activity.
- Click an area of the stack chart to select the corresponding line in the Host list.
- Click and drag a region of the chart to reset the time range to that area of the stack chart.
- Click Set Graph Scale to set the vertical scale for the stack chart. Select Auto to normalize the scale to the displayed data, or select a scale between 1Kbits/second and 10GBytes/second.
- Right-click an area of the dtack chart and select from the context menu as described below.
Pie Chart
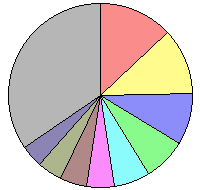
You can use the Pie chart to view the relative activity of each top host in proportion to the others.
- Click a pie segment to select the corresponding line in the Host list.
- Mouse over a pie segment to view the host address for that segment.
- Right-click an area of the Pie chart and select from the context menu as described below.
Host List
You can use the Host List to view detailed statistics about a particular host. Below is a typical host list, which shows the top 25 hosts.
- Click a column heading to sort by that column. Click again to reverse the sort.
- Click an unselected row to select it.
- Shift-click an unselected row to select all rows between that row and the currently selected row.
- Ctrl-click a row to select or de-select it.
- Right-click a line or IP address from the Host list and select from the context menu as described below.
| Legend | Hostname | Address | Country | Bytes | % | In | Out | Client | Server |
|---|---|---|---|---|---|---|---|---|---|
| 207-234-147-42.ptr.example.com | 207.234.147.42 | 385.5KB | 13.03 | 41.7KB | 385.5K | 3.9KB | 381.6KB | ||
| example.net | 64.65.64.89 | 343.3K | 11.61 | 35.2KB | 343.3KB | 0b | 343.3KB | ||
| nwk-www.example.com | 17.149.160.10 | 267.7KB | 9.05 | 12.9KB | 267.7KB | 0b | 267.7KB | ||
| dhcp-122.dartware.com | 192.168.1.122 |

|
223.0KB | 7.54 | 1.1MB | 223.0KB | 217.5KB | 5.5KB | |
| cup-www.example.com | 17.251.200.32 | 189.9KB | 6.42 | 8.1KB | 189.9KB | 0b | 189.9K | ||
| vws.example.net | 64.65.64.19 | 142.3K | 4.81 | 17.2KB | 142.3KB | 0b | 142.3KB | ||
| nitro.dartware.com | 192.168.1.45 |
|
141.1KB | 4.77 | 670.4KB | 141.1KB | 74.2KB | 66.9KB | |
| dhcp-124.dartware.com | 192.168.1.124 |
|
125.1KB | 4.23 | 76.6KB | 125.1KB | 83.9KB | 41.2KB | |
| hosting.example.com | 216.251.32.98 | 115.8KB | 3.91 | 8.5KB | 115.8KB | 0b | 115.8KB | ||
| eclair.example.net | 64.65.64.64 | 98.1KB | 3.32 | 18.8KB | 98.1KB | 0b | 98.1KB | ||
| outgoing02.example.net | 64.65.64.125 | 69.2KB | 2.34 | 26.0KB | 69.2KB | 0b | 69.2KB | ||
| 192.168.1.12 | 192.168.1.12 |
|
63.3KB | 2.14 | 67.8KB | 63.3KB | 25.5KB | 37.8KB | |
| <up to 25 rows> | |||||||||
| Other | Other | 396.5KB | 13.40 | 555.8KB | 396.5KB | 118.5KB | 278.0KB |
- Legend - The top 10 hosts are indicated with color legends. The report shows the top 25 hosts or ports, but places the Other category at the bottom of the list, as it shows total traffic for the remaining hosts or ports not shown in the previous 24 rows.
- Hostname - the host name of the talker or listener.
- Address - the IP address of the talker or listener.
- Country - a flag indicating the country in which the host name or IP address originates.
- Bytes - the volume of traffic (in bytes/kbytes/mbytes) for a particular row in the specified time interval.
- % - the percentage of traffic attributed to this host during the specified time interval.
- In - the number of bytes received by the host's IP address.
- Out - the number of bytes sent from the host IP address.
- Client - the number of bytes transmitted when the host acted as a client (for example, sending a request to another server.)
- Server - the number of bytes transmitted when the host acted as a server (for instance, when responding to a request from a client).NOTE: Intermapper Flows uses the following heuristic rules to determine which host is operating as a client or server:
- It has a built-in list of common server ports. If the port matches an entry in the list, it is treated as a server.
- If there is no match with a common host port, the lower-numbered port is treated as a server.
- Packets - the number of packets sent or received by this host.
- Sessions - the number of sessions including this host.
Context Menu - Top Hosts tab
Right-click or Ctrl-click (macOS) on the Stack chart, Pie chart, or Host list, and select from the Context menu as follows:
Stack chart
- Select On [host] - includes only traffic from the selected host.
- Exclude [host] - excludes traffic from the selected host.
- Center on this - centers the stack chart on the selected point in the timeline.
Pie chart
- Select On [host] - includes only traffic from the selected host.
- Exclude [host] - excludes traffic from the selected host.
Hosts List
- Select All - selects all rows of the table
- Filter on selected host - includes only traffic to or from the selected host.
- Exclude selected host - excludes traffic from the selected host.
- Copy selected rows - copies the fields from the selected table rows to the clipboard.
- Copy IP address - copies only the IP address from the selected row to the clipboard.
- Whois Lookup - see the Whois description for the selected host.