Top Ports Tab
Click the Top Ports tab (or type Ctrl-2) to view a list of ports with the highest activity, with stack and pie charts showing the relative activity of each.
Stack Chart
You can use the Top Ports tab's Stack chart to view the relative activity of different ports over time. Each port's activity is stacked with the others, with the top port on the bottom of the graph. For example,
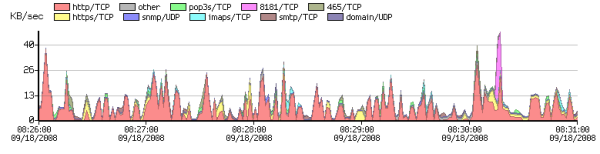
The legend above the chart shows the top hosts for the data you are currently viewing.
- Click a legend above the Stack chart to select the corresponding line in the Port list.
- Mouse over an area of the Stack chart to view port information for that activity.
- Click an area of the stack chart to select the corresponding line in the Port list.
- Click and drag a region of the chart to reset the time range to that area of the Stack chart.
- Click the Set Graph Scale button to set the vertical scale for the Stack chart. Select Auto to normalize the scale to the displayed data, or select a scale between 1Kbits/second and 10GBytes/second.
- Right-click an area of the Stack chart and select from the context menu as described below.
Pie Chart
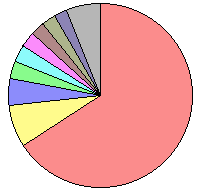
You can use the Pie chart to view the relative activity of each top port in proportion to the others.
- Click a pie segment to select the corresponding line in the Ports list.
- Mouse over a pie segment to view the port corresponding to that segment.
- Double-click a segment of the pie chart to set a filter allowing you to view data only for the selected port.
- Right-click or Ctrl-click a point in the timeline and select Center on This from the context menu to bring a particular point in the Stack chart to the center of the timeline.
- Double-click a pie segment or right-click or Ctrl-click a segment and select Select on Port/Protocol [Service or Port number] from the context menu to set a filter for that port.
- Right-click an area of the Stack chart and select from the context menu as described below.
Ports List
You can use the Ports List to view detailed data about the top 25 ports.
- Click a column heading to sort by that column. Click again to reverse the sort.
- Click an unselected row to select it.
- Shift-click an unselected row to select all rows between that row and the currently selected row.
- Control-click a row to select or de-select it.
- Right-click or Ctrl-click a row and select Select All to select all rows.
-
Right-click a selected row and select Copy Selected Rows to copy the currently selected set of rows to the clipboard in tab-delimited format.
Legend Service Protocol Port Bytes % HTTP TCP 80 1.9MB 65.76 HTTPS TCP 443 223.8KB 7.57 SNMP UDP 161 134.8KB 4.56 SNMP UDP 161 134.8KB 4.56 SNMP UDP 161 134.8KB 4.56 8181 TCP 8181 78.3KB 2.65 SMTP TCP 25 74.0KB 2.50 465 TCP 465 72.2KB 2.44 1278 UDP 1278 41.6KB 1.40 ICMP ICMP 22.7KB 0.77 1220/TCP TCP 1220 17.1KB 0.58 1220/TCP TCP 1220 17.1KB 0.58 106/TCP TCP 106 11.6KB 0.39 < up to 25 rows > OTHER IP 13.4KB 0.45
- Legend - the top 10 ports are indicated with colored legends. The report shows the top 25 ports, but places the Other category at the bottom of the list, as it shows total traffic for the remaining ports not shown in the previous 24 rows.
- Service - the name of the server associated with the port.
- Protocol - the protocol (TCP/UDP/GRE/ICMP) associated with the port.
- Port - the port number
- Bytes - the volume of traffic (in bytes, kbytes, or mbytes) for a particular row in the specified time interval.
- % - the percentage of traffic for the specified port in the specified time interval.
Context Menu - Top Ports Tab
You can right-click or Ctrl-click (macOS) on the Stack chart, Pie chart, or Ports list and select from the Context menu as follows:
Stack chart
- Select On [port] -includes only traffic from the selected port.
- Exclude [port] - excludes traffic from the selected port.
- Center on this - centers the stack chart on the selected point in the timeline.
Pie chart
- Select On [port] - includes only traffic from the selected port.
- Exclude [port] - excludes traffic from the selected port.
Ports List
- Select All - selects all rows of the table.
- Filter on selected port - includes only traffic to or from the selected port.
- Exclude selected port - excludes traffic from the selected row.
- Copy selected rows - copies the fields from the selected table rows to the clipboard.
- Copy IP address - copies only the IP address from the selected row to the clipboard.
- Whois Lookup - see the Whois description for the selected port.