Debug Log
Intermapper contains the following debug logs:
- The Server Debug Log - available from the Logs submenu of the Window menu.
- The Client Debug Log - available from the Diagnostics submenu of the Help menu.
Server Debug Log
The Server Debug log contains details of the Intermapper server's operations that can help troubleshoot various configuration problems. It stores messages generated by the server.
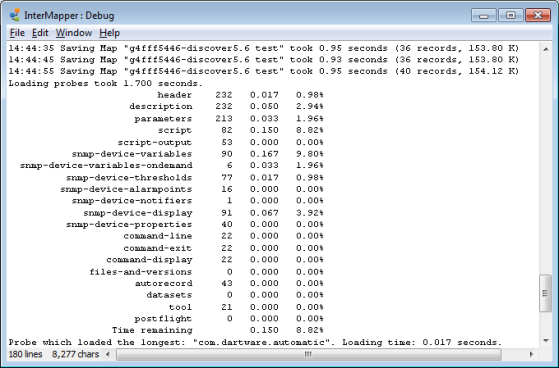
The following are examples of information that is stored:
- A series of messages generated when the server is started or stopped.
- A message when a map is opened or saved.
- A series of messages when probes are reloaded.
- Most messages contain an indicator of how long a particular operation took.
To open the Server Debug log:
From the Logs submenu of the Window menu, select Debug.
Client Debug Log
The Client Debug Log shows details of Intermapper's operations that can be valuable for debugging problems with the program. If you have trouble with Intermapper, the support staff might ask you to Send Feedback. The Send Feedback form sends the Client Log by default.
Client Debug Log Window
The Client Log Window shows the contents of the Client Log.
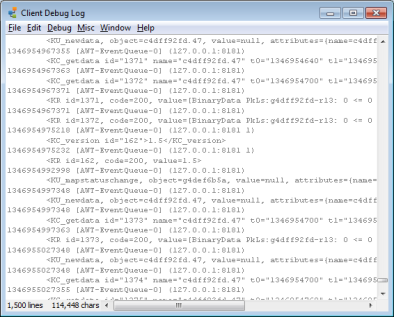
To open the Client Debug Log:
From the Diagnostics submenu of the Help menu, select Client Debug Log.
| macOS: | Command + Option + Shift + Z |
| Microsoft Windows: Linux: |
Control + Alt + Shift + Z |
The Client Debug Log window is displayed and the Debug and Misc menus are displayed in the menu bar at the top of the window.
In general, Fortra does not document the information shown in the Client Debug Log window, because its messages change from version to version.