Viewing Status Windows
Intermapper shows detailed status about any item on a map (a device, a network, or a link) in a Status window.
To view device, network, or link status:
- Ensure your map is in Monitor mode (click the lock at the upper left of map window to lock the map, or press Tab on your keyboard).
- Click and hold a device, network, or link on the map, or right-click the device, network, or link, and select Status Window. The Status window for the selected device is displayed.
- Release the mouse button to hide the Status window.
To keep a Status window open:
- Ensure your map is in Monitor mode.
- Click and hold the device, network, or link on the map.
- Drag to a new location and release the mouse. You separated the window and it remains open, located where you released the mouse.
Customizing a Status Window
If you are using a custom TCP or SNMP probe, you can override the default contents of a Status window. For more information, see Custom Probes and Customizing Status Windows in the Developer Guide.
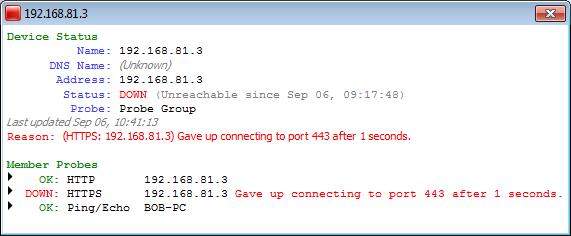
Device Status Window
- Click and hold the mouse on a device to open its device status window, or right-click the device and select Status Window.
- Click and drag to tear the window off and leave it open.
-
Click the underlined Reset link to set Packet Loss to 0. This also resets the device's availability measurement.
The window shows the device name, network address, device status, the probe used to poll it, up-time (such as SNMP sysUptime, if available), availability (the percentage of the time the device is available based on the number of packets lost while testing), round-trip time (in msec), and spanning tree status (if available).
When the device reports a problem, the reason for the most important error is shown in red at the bottom of the Status window.
Network Status Window
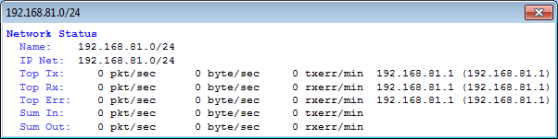
- Click and hold the mouse on a network oval to open its network status window, or right-click the network and select Status Window.
- Click and drag to separate the window and leave it open.
The network status window shows the network IP address and subnet mask (if available) and information about the amount of traffic flowing on that network segment.
This data comes from all the SNMP devices attached to that network
oval.
- Top Tx - Shows which device is transmitting the most data.
- Top Rx - Shows which device is receiving the most data.
- Top Err - Shows which device is reporting the highest error rate for the link.
- Sum In/Sum Out - Shows the sum of all the transmitters and receivers
connected to that network.
Link Status Window
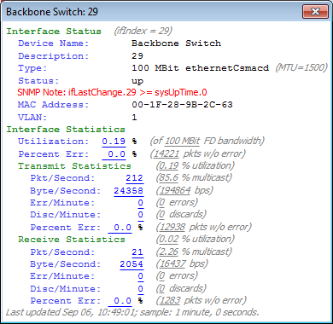
- Click and hold the mouse on a link or right-click the link and select Status Window to open its link status window.
- Click and drag to separate the window and leave it open.
The link status window shows the link's interface name and description, its type (10 or 100 Mbps, 1.5 Mbps T-1, and so on), its status and up-time, its IP and MAC addresses (when available), traffic statistics (transmitted from and received by the interface), and the time since the last poll.
Certain devices do not report their link speed accurately in their SNMP responses. This causes Intermapper to report a value which is not actually correct. To work around this, switch the map to Edit mode and right-click the link and select Set Link Speed. The Set Link Speed window is displayed, allowing you to set Transmit and Receive speeds.