Diagrams
The Diagram tab displays a graphical view of the selected Job, including its upstream and downstream Jobs/dependencies. An upstream reference is anything that causes or prevents the selected Job from running, and a downstream reference is anything the selected Job causes to happen or prevents from happening. The diagram also displays any preconditions for the selected Job.
You can use this tab with the Job Definition, Monitor, and History views to see the end-to-end process of the Job, including any other Jobs that may run because of this Job. You can use this tab for:
- Setting up Jobs - You can view all dependencies between multiple Jobs, which can help to ensure the Job is configured properly.
- Auditing Job failures - You can get a better understanding of why a dependent Job failed and the effect on other Jobs. This can be helpful for Sequence Jobs that have many child Jobs.
- Monitoring Critical Jobs - You can easily view a critical Job to see if any previous Jobs have an impact on its ability to run.
Accessing the Diagram
You can access the Diagram for a selected Job/Entry from several areas within JAMS. The options and display of the Diagram will vary based on where you open it. Do one of the following:
Access the Diagram from a Job Definition
When you open the Diagram tab from a Job Definition, the Jobs are displayed as gray and do not show the current status.
- Click the Definitions view from the Shortcuts menu.
- Right-click the Job and select Diagram, or double-click the Job and select the Diagram tab.
Access the Diagram from an Entry in the Monitor view
When you open the Diagram tab from the Monitor view, the Jobs are displayed in color and show the current status. You can also right-click a Job on the Diagram tab and have access to the same right-click menu options that are available in the Monitor view.
- Click the Monitor view from the Shortcuts menu.
- Right-click the Entry and select Diagram. The selected Job is highlighted on the Diagram.
Access the Diagram from an Entry in the History view
When you open the Diagram tab from the History view, the Jobs are displayed in color and show the final status. You can also right-click a Job on the Diagram tab and have access to the same right-click menu options that are available in the History view.
- Click the History view from the Shortcuts menu.
- Right-click the Entry and select Diagram.
Diagram Overview
The Diagram flows from top-to-bottom and dynamically updates as you click the blue/gray arrow buttons on the Job. By default, the Diagram is fully expanded so you can see all upstream and downstream Jobs for the selected Job. (You cannot hide the Job that was selected for the Diagram.) Each Job is displayed on the Diagram, and it is sized to fit the information on the screen. The Diagram displays Jobs, Sequence Jobs, and conditions.
Jobs
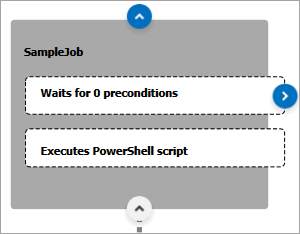
Each Job is displayed as a square on the Diagram and has the information listed below. If you open the Diagram from the Monitor view, live status and statistics are also displayed.
| Option | Description |
|---|---|
| Job Name | If the name is truncated, you can hover your cursor over the Job name to view the full name in a tooltip. If the Job has been deleted or a user account does not have Inquire access for a Job that is referenced on the Diagram view, the Job name displays “Unable to Load Job”. The tooltip displays the reason the Job could not be loaded. Also, the Job cannot be expanded. |
| Number of Preconditions | This option displays any dependencies/prerequisites enabled from the Schedule tab in the Job Definition. To view the specific dependencies/prerequisites, click the arrow next to “Waits for x preconditions”. (The text changes to “Waiting for x preconditions” when more than one of the prerequisites have completed.) A description of the item and its values are displayed. The following options from the This Job depends on a … menu in the Schedule tab can be displayed: Job, Job (date specific), Pre-Check Job, File, Variable, Resource, and Time Window. |
| Jobs to Execute | This option displays any Jobs that will be started because of the selected Job. |
Sequence Jobs
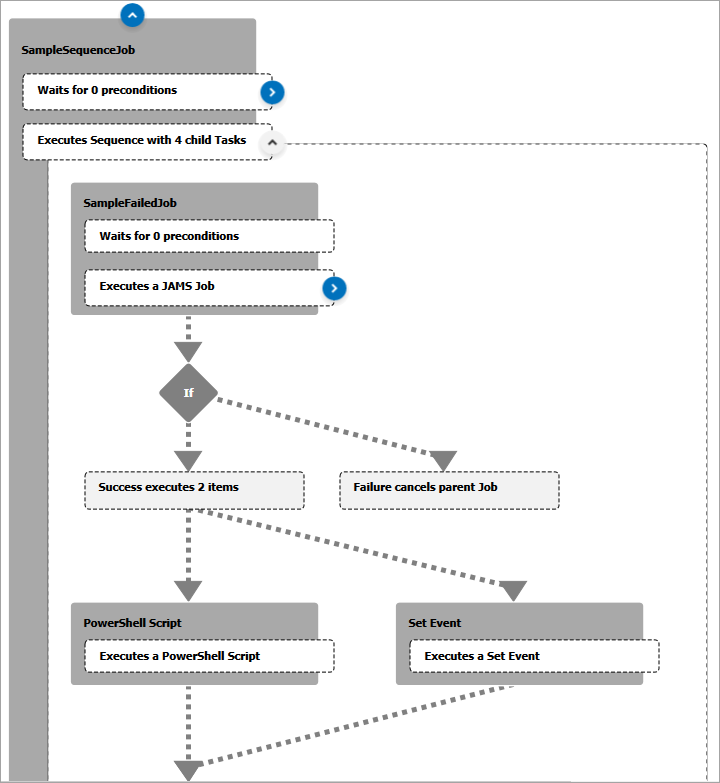
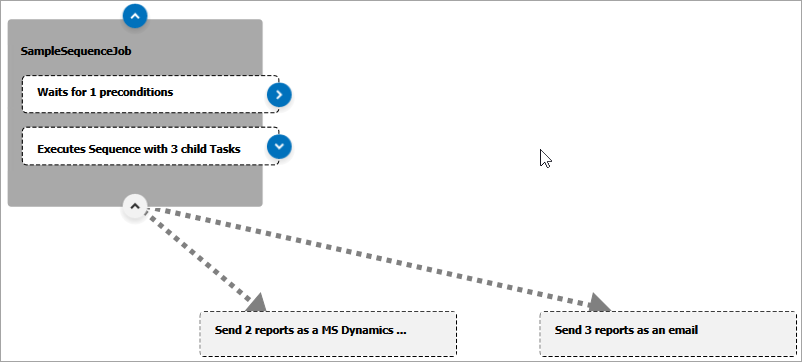
A Sequence Job displays the same information as a Job, but it also includes any child Tasks. These are listed by the Task name within the main Sequence Job on the Diagram. If the Sequence Job contains another Job by using the Submit Job Task, the Task node displays the number of Preconditions that are set on the Submit Job Task. Expanding the Sequence Task node will add the Job that is displayed outside the Sequence Job.
If you open the Diagram from the Monitor view, live status and statistics are also displayed.
Sequence, Parallel, and Failure Action Tasks
The Sequence Task and Parallel Task are not displayed as containers on the Diagram. Any Tasks within them are still displayed. For example, the Parallel Task container is displayed by two Tasks that are side-by-side and connected by arrows.
A Failure Action Task is displayed as a Job node with a conditional If node under it that lists the action if the Job fails or completes. Each Job within the Failure Action Task has its own conditional If node. If the Failure Action Task is set to Fail or Not Specified, the node displays “Failure cancels parent Job”. If the Failure Action Task is set to Continue, the node only displays the number of Jobs/items that will run.
Conditions
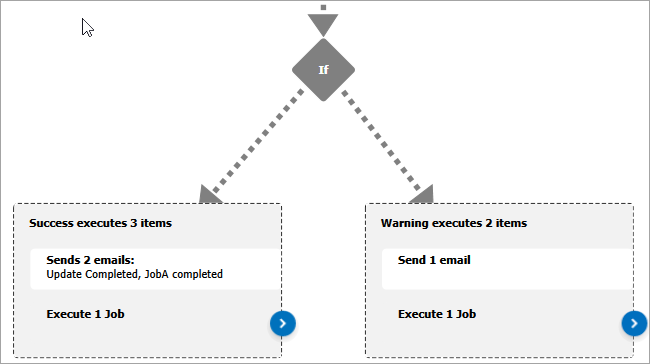
Any conditions are displayed with an “If” node that details the actions that have multiple options. This allows you to see all possible outcomes for each option. For example, you may see conditions if the Job will behave differently based on the completion severity.
Viewing Upstream References
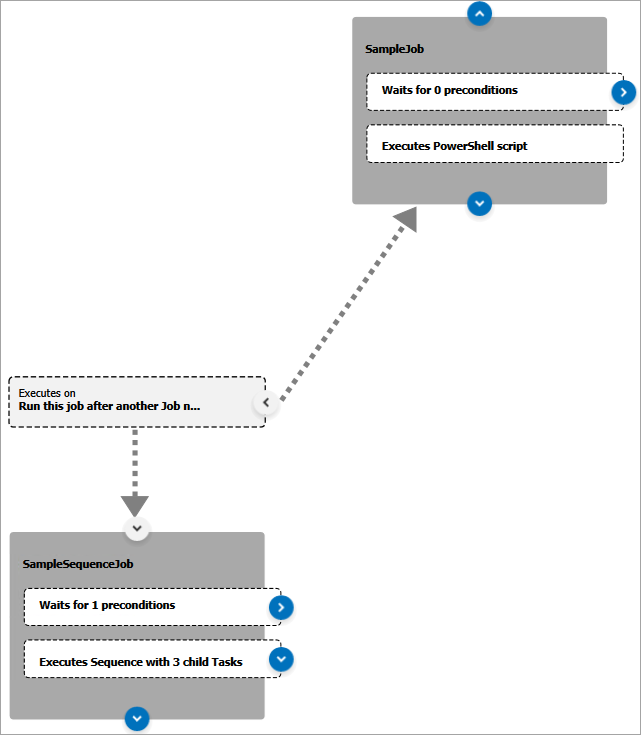
By default, all Jobs are displayed when you open the Diagram tab. This can include other Jobs that run before the selected Job or any schedule trigger items from the Run this Job menu on the Schedule tab. This also includes any schedule trigger set on an upstream Job. These Jobs are displayed above the original Job and have arrows that indicate any dependencies or relationships. If the text is truncated, you can hover your cursor over it to view the full text in a tooltip.
If an upstream reference is disabled, it will not be displayed as grayed out. Ensure you check the Job or schedule trigger item as needed.
- Click the blue arrow on the top of the Job to display any upstream references.
- Click the gray arrow on the top of the Job to hide any upstream references.
Viewing the Preconditions for a Job
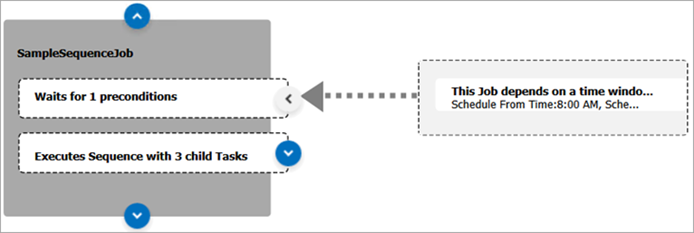
Preconditions can include any prerequisites/dependencies that have been set on the Schedule tab of the Job. The following options from the This Job depends on a... menu in the Schedule tab can be displayed: Job, Job (date specific), Pre-Check Job, File, Variable, Resource, and Time Window.
-
Click the blue arrow pointing to the right. A tree view is displayed that lists the preconditions for the Job.
-
Click the gray arrow to hide any preconditions for the Job.
Viewing Downstream References
Downstream references can include other Jobs that are run after the selected Job has finished running on the Scheduler. This includes options from the When an event occurs menu and the Send a Report menu, such as emails, notification Jobs, recovery Jobs, or reports.
Downstream references are displayed as an aggregate. For example, if there are multiple reports and some have been disabled, the Report node will not be grayed out. The node is grayed out only if all reports have been disabled.
-
Click the blue arrow on the bottom of the Job to display any downstream references.
-
Click the gray arrow on the bottom of the Job to hide any downstream references.
Emails, Notification and Recovery Jobs
Event handler options in the When an event occurs menu on the Schedule tab are displayed on the Diagram. These options are grouped by event type, including Entry Success, Entry Informational, Entry Warning, Entry Error, Entry Fatal, Entry Started, Normal Event, Low Event, Moderate Event, High Event, Urgent Event, and Critical Event.
If you have multiple schedule events based on one event type, one box is displayed on the Diagram for those multiple schedule events. In the example below, multiple emails are defined for the Success and Warning event types. If multiple emails have been configured, the email subject is displayed on the Diagram.
Click the blue arrow to expand and view the Job.
Reports
Report options in the Send a Report menu on the Schedule tab are displayed on the diagram directly under the Job. If you have multiple report options, one box is displayed on the Diagram for each of those options. If the text is truncated, you can hover your cursor over it to view the full text in a tooltip.
Modifying the Diagram View
The Diagram tab has several options to let you focus on specific parts of the diagram. The following options are displayed in the lower right corner of the screen.

Toolbar Options
| Option | Description |
|---|---|
| Overview | Click Overview to see the full Diagram in a smaller window. This smaller window will update as you move your cursor within the Diagram. A box within the window shows the selected section of the Diagram. |
| Fit | Click Fit to get the optimal view of all Jobs in the Diagram tab. If you selected any Jobs, they will have a purple border and will be included in the tab. |
| Fill | Click Fill to have the diagram adjust the view to display all Jobs in the Diagram tab. |
| 100% | Click 100% put the view back to the default view scaling state. |
| + - (Scaling) | Click the + or – buttons to increase or decrease the scaling of the Diagram. |
Modifying a Job
If you open the Diagram tab from the Job Definition, you can view and modify the properties and options for a Job that is referenced within the diagram. If you make any changes, the changes apply to all instances of the Job. For a Submit Job Task in a Sequence Job, click the blue arrow on the Task to expand the Job to access the Properties option on the right-click menu.
-
Access the Diagram tab from a Job Definition.
-
Right-click the Job and select Properties.
-
View the properties or make any modifications to this Job.
-
Save and close the dialog.
-
To view the changes on the Diagram tab, save the changes and reopen the Job Definition.
Viewing the Real-Time Status of an Entry
If you open the Diagram tab from the Monitor view, you can see the Entry Number next to the Job name and the real-time status in the right corner of the Entry. You can also see the status for any of the Entry's preconditions or child Tasks, if it is a Sequence Job. The color, icon, and text of the Entry changes based on its status. The same colors and icons are displayed in the Monitor view and the Diagram tab. See Using the Monitor for more information. An additional icon  is available on the Diagram tab to show Jobs/Entries that did not run.
You can hover your cursor over a Job or a Job in a Submit Job Task to view a tooltip displaying key statistics for the Job, including average run time, current elapsed time, and the expected time to completion.
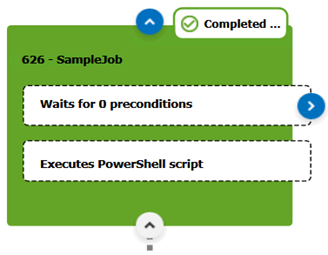
You can right-click a Job or a Sequence Task in the Diagram tab and access the same right-click menu options that are available in the Monitor view. This allows you to complete common actions such as canceling, releasing, holding, and rescheduling a Job.