Appendix A: Job control and system performance
Out of the box, Database Monitor can handle most production environments without too much tweaking. As more functions are transferred to Database Monitor and complexity of requirements increase, several advanced features can be activated to handle the workload and improve throughput.
This appendix is dedicated to functionality which is available for more granular control of Database Monitor.
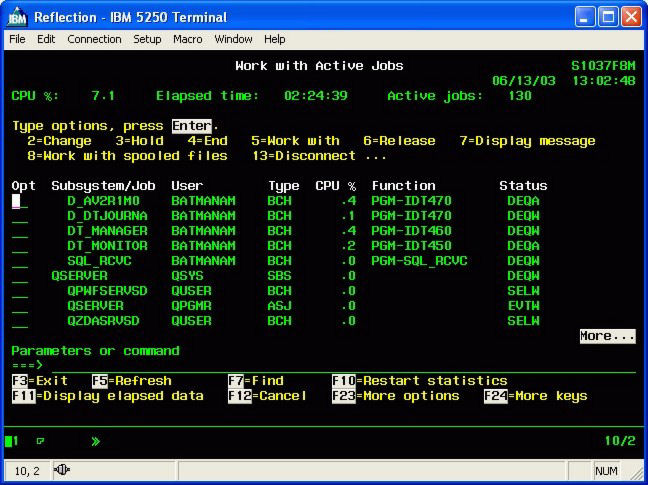
The screen below represents some of the jobs which may run to support Database Monitor.

Two jobs starting with "D_" are indicators that Database Monitor is monitoring two separate journals. Each monitored journal will have its own job. Several files may be attached to a single journal.
DT_MANAGER is the main "Traffic Cop" for Database Monitor. At all times, only one of these jobs should run for each instance of Database Monitor. Since each monitoring job (triggers) makes sure that the manager is running, there may be occasions that more than one manager is seen as running. The second and subsequent instances will simply end, however, when they realize the first instance is already running.
DT_MONITOR is the process which has all the necessary intelligence to process a change, and perform configured activity. Based on entries in the system parameters, one or more monitor jobs may execute at the same time.
There may be other jobs that support the email approval functionality. These jobs are DT_WIM_SCK and
DT_WIM_490. See here for more information.
Startup
The Manager is the program which starts and ends all activity. It is the program which is submitted by the initialization of all trigger programs. Since only one instance of the Manager runs, the other submissions end immediately. It is often a good idea to kick off the Manager upon start of a day or after nightly saves have been completed. This job can be scheduled and assuming that the library of Database Monitor is called DATATHREAD the Manager can be initiated by the following command
CALL DATATHREAD/STR460
Upon startup, the Manager will check the Database Monitor setup for integrity. Files that may have been locked when they were set up for monitoring will probably be free and triggers can be activated. The Manager will then activate all the other jobs.
Shut down
It's important that the Database Monitor jobs be ended using the normal means within the software. Doing an ENDJOB command is not recommended, as the current transaction being processed could be incomplete.
CALL DATATHREAD/END460
This command will notify Database Monitor that it must shut down. First all of the secondary jobs will be ended and finally the Manager itself will close down. It is important to note that the Monitor may be in the midst of processing changed records when a shut down is requested. The remaining and unprocessed entries will be handled as soon as the Monitor is brought back up. No data is lost, however, when the Monitor is ended this way.
Keep in mind that any activity on a file being tracked by Database Monitor will cause the Manager to start up. So, it is quite possible that the END460 is executed and within seconds the Manager is back up. To avoid this, Database Monitor can be given its own job queue and the queue should be held for the duration of saves.
Subsystems and job queues
If you have not already done so, it is recommended that Database Monitor be given its own specific job queue. For our examples we will use JOBQ QUSRSYS/DATATHREAD. This job queue should allow at least 10 active jobs. The queue can be attached to an existing subsystem, or a specific subsystem can be created for Database Monitor. In either case, you should take into account the possibility that, including workflow jobs, 10 or so Database Monitor jobs can be running at one time.
If you do create a Database Monitor subsystem, it is critical that it be started as part of the system startup.
Sample job control for saves
HLDJOBQ DATATHREAD
CALL DATATHREAD/END460
SAVES
CALL DATATHREAD/STR460.
RLSJOBQ DATATHREAD
When ending Database Monitor is not enough
As we have discussed, even when the Manager is down, files being monitored by Database Monitor triggers will continue to capture changes and deposit them into the Database Monitor queues. Through the use of several data queues and an overflow file, Database Monitor ensures that data is not lost. On occasion it may make sense to suspend monitoring of a file. Certainly this can be done through the user interface, however, two methods exist to perform the task as part of a batch process.
Turn off monitoring for a single file
Program IDT550 is used to turn on and off monitoring of a single file. The following are the parameters used for the call:
Leave On Error The process for affecting monitoring of a file from within a batch job would be
ALLOCATE THE FILE EXCLUSIVELY
MONITOR FOR A GOOD ALLOCATION
CALL IDT550 PARM('DATATHREAD' 'TSTLOT' 'D' 'N' '')
MONITOR FOR 'E' IN THE ERROR CODE
DO YOUR PROCESSING
ALLOCATE THE FILE EXCLUSIVELY
MONITOR FOR A GOOD ALLOCATION
CALL IDT550 PARM('DATATHREAD' 'TSTLOT' 'A' 'N')
MONITOR FOR 'E' IN THE ERROR CODE
Turn off monitoring for all files
There are times when it is necessary to turn off monitoring over all files in a library, or even all files being tracked by Database Monitor. Program IDT465 is used for this purpose. The following are the parameters used for the call:
On Off
Library The process for affecting monitoring of a file from within a batch job would be
CALL IDT465 PARM('0' 'LIBNAME' ' ')
MONITOR FOR '1' IN THE RETURN CODE
DO YOUR PROCESSING
CALL IDT465 PARM('1' 'LIBNAME' ' ')
MONITOR FOR '1' IN THE RETURN CODE
Unlike the single file activation and deactivation by IDT550, the mass on off function updates the activation flag of the Database Monitor configuration to 'H' (hold). It is possible to run the activation/deactivation multiple times until all files have been changed. Perhaps a loop with a delay could be used to catch all files that could not be allocated the first time through.
System performance - overview
There are many variables that affect the performance of Database Monitor. First and foremost is the workload already being handled by the AS/400. If the resources of the system are already constrained, the impact from implementation of Database Monitor may be more noticeable. However, on a properly sized system, the impact should be negligible.
Beyond the basic configuration with which Database Monitor ships, there are several advanced features which can be utilized to improve throughput and performance. To understand these, let us first review areas of activity. Database Monitor functionality can be categorized into three areas:
- Database monitoring and change awareness
- Background processor and Standard WorkFlow
- Custom WorkFlow Processing
Database monitoring and change awareness
Database Monitor uses two possible techniques to monitor database activity.
- Triggers
- Journals
Triggers
Triggers are inline programs called by the IBM database manager. Each time a record is inserted, changed or deleted the trigger program can be initiated. The program will capture the before and after image of the record and pass the information to the Database Monitor Monitor which is running in batch. There are several features of Database Monitor which can be activated to reduce the impact of trigger processing:
Capture only the event you need

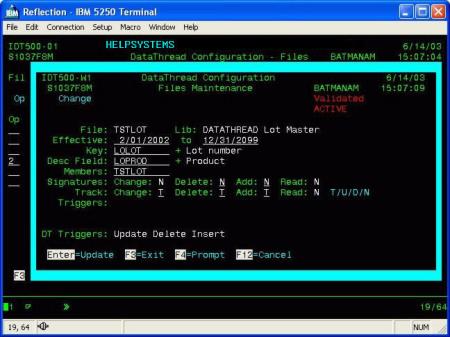
As you can see from the image above, Database Monitor allows for activation of monitoring at the individual event level. If for example, your business process requires you to monitor whenever a record is added, but not when it is changed or deleted, then only activate the add trigger. For regulatory audit purposes, this may not be an option, but for workflow, it may.
Do you really need the program name?
One of the most time expensive actions performed by the trigger program is to identify the name of the program causing the change. Time taken for each database action can be reduced by over 20% if the name of the program is not retrieved. The function is controlled by the JOB-PROG entry on the Powertech Code Types Maintenance panel. If a job has an entry in this table, the trigger functions will simply accept the associated program name without checking. This is most useful for batch jobs with predictable programs.
I do not want to track all the updates from the costing run
There are those jobs, and we all have dealt with them, which perform an immense number of updates to insignificant (from an auditing point of view) fields. For example a costing run from one of the popular ERP systems starts by updating a costing flag in every item master record. It then updates the cost field for some records. Finally it releases every record. These events may have no significance from an auditing or even a workflow point of view. However, since the item master is being monitored for other fields, hundreds of thousands of records will be processed by the trigger program and passed to the monitor, only to be discarded. The system code 400JOBEXCL on the Powertech Code Types Maintenance panel allows Database Monitor configurators to exclude jobs from monitoring. The trigger program will still fire, but will immediately return without submitting the data to the data queue.
It is important to note the Database Monitor triggers will become aware of new entries in this table within one minute of the entry. If a job is being significantly affected, an entry can be made while the job is active.
Do you have the right data queues defined?
Database Monitor uses a cascading algorithm to write trigger information to the data queues. If one data queue is filled before the Monitor can start processing the entries, second and subsequent queues are utilized. If all the queues get filled, the data is written to a database file called IDTOVR.
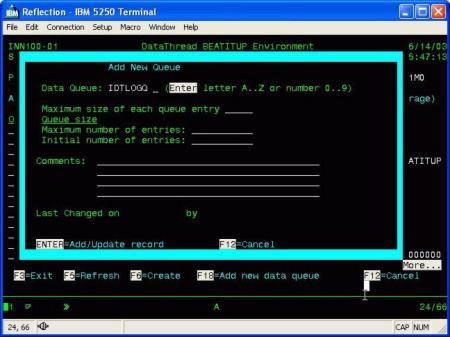
Database Monitor ships with several data queues pre-defined. If you notice data spilling over into IDTOVR, you should create additional data queues. This is done from the system parameter screen, Option 12.

The maximum size of the data queue entry is the combined length of the before and after image of the widest file being monitored, plus two to three hundred characters. If you perform a DSPFD on the TSTLOT file you will see a total record length of 34. The before and after image will take up 68 characters. Adding, say, 300 bytes to this, we see that a data queue with a maximum length of 368 would be able to handle entries for this file.
If most of the files being monitored require a data queue under 1000 characters wide, but one file is much wider and gets a few changes here and there, we would recommend making most of the data queues 1000 characters. You could then define one queue to fit the much larger file. Database Monitor will determine the size appropriateness of a queue before attempting to post to it.
The maximum number of entries defaults to *MAX16MB; for V5R1 and beyond *MAX2GB is the recommended entry.
Journals
If your environment is already using journaling for application integrity or high availability, the decision between using journaling or triggers within Database Monitor is simple. All the information needed by Database Monitor is already being captured.
Database Monitor does not need the file open/close history, but having both the before and after images captured is highly desirable. We can manage with just the after image, but some workflow functionality will be lost.
Since the journaling is entirely handled by the database manager, there is little additional efficiency that can be garnered at the data capture component.
Background processor and Standard WorkFlow
Whether triggers or journals are used for capturing database changes, each change is sent to a series of data queues for asynchronous processing by the Monitor. Standard Database Monitor configuration will activate one DT_MONITOR job as the background processors are brought online.
This job is responsible for:
- Receiving transactions from the data queues
- Determining if the change is significant
- Capturing audit data
- Sending out notifications
- Performing work flows
Because the data queues have a finite amount of space and we want to avoid spilling over into the IDTOVR file, the Monitor program concentrates on receiving the data queue entries.
During times of very heavy transaction processing, it is conceivable that the Monitor will be constantly draining the data queue and not get to the next set of tasks. It will certainly process those tasks once database updates subside.
To better manage these bottle neck times, Database Monitor can be configured to run multiple instances of the Monitor. The system parameter variable MAX-450 in option 12 controls this function. The second and subsequent Monitors will simply process steps 2 and beyond.
Each call to the program STRMON will start a single instance of the Monitor.
The program ENDMON will end one instance of the Monitor. This program can also be called with a parameter of ALL or a number. ALL will end all instances of the monitor. Or if for example it is called with '2' as the parameter it will end two instances.
Procedurally, jobs can be scheduled to handle I/O intensive time periods. For example if a distribution wave is being run, the following sequence might be useful:
CALL STRMON
RUN WAVE
CALL ENDMON
Custom Workflow Processing
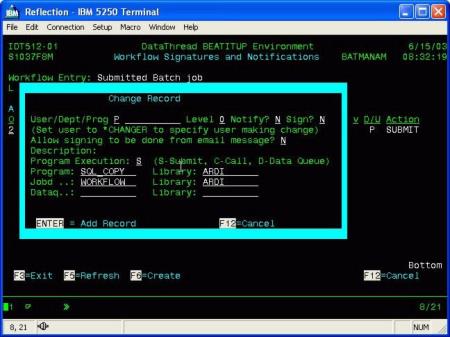
Database Monitor standard Workflow processing sends notification of change, when configured values are matched. One of its most powerful features, however, is the ability to initiate other programs. See appendix D for more detailed information
How these programs are accessed, can significantly affect throughput. The choices are:
- Submit the program
- Call it directly
- Send a request to a data queue

Submit the program
Very useful when number of transactions is low. Each submitted job will have its own characteristic based on the configured job description. Individual joblogs will be available and library lists can be established based on each workflow. If, however, a significant number of jobs are to be processed the overhead associated with each job will become expensive. Under this condition, either the direct call or the data queue processing should be considered.
Call it directly
A direct call is the fastest way to perform a WorkFlow transaction; especially if the called program is kept open and ready for multiple calls. There are several disadvantages to the direct call method and great care should be taken before it is implemented. It is important to remember that the Monitor itself will be affected by any events that affect the called program. Abnormal termination of the called program may hold up the Monitor’s processing with serious consequences. Also, the Monitor runs with an environment neutral library list. Changing the library list of the called program will impact the processing of the Monitor.
Send a request to a data queue
Data queue processing seems to provide the best compromise approach. The monitor will send an entry to the specified data queue with the transaction number, name and library of the program that is to be called. There will need to be a program running that will receive this entry and act upon it. In performance testing we have determined that this approach is at least 5 times faster than submitting individual programs.
This is a simple example of a Database Monitor data queue receive program:
0001.00 PGM PARM(&DQNAME &DQLIB)
0002.00 DCL VAR(&DQNAME) TYPE(*CHAR) LEN(10)
0003.00 DCL VAR(&DQLIB) TYPE(*CHAR) LEN(10)
0004.00 DCL VAR(&DQLEN) TYPE(*DEC) LEN(5 0) VALUE(35)
0005.00 DCL VAR(&DQDTA) TYPE(*CHAR) LEN(35)
0006.00 DCL VAR(&TR ) TYPE(*CHAR) LEN(15)
0007.00 DCL VAR(&DQWAIT) TYPE(*DEC) LEN(5 0) VALUE(100)
0008.00 DCL VAR(&PROGRAM) TYPE(*CHAR) LEN(10)
0009.00 DCL VAR(&PGMLIB) TYPE(*CHAR) LEN(10)
0010.00 LOOP:
0011.00 CHGVAR &DQDTA ' '
0012.00 CALL PGM(QRCVDTAQ) PARM(&DQNAME &DQLIB &DQLEN +
0013.00 &DQDTA &DQWAIT)
0014.00
0015.00 IF (&DQDTA *NE ' ') DO
0016.00 CHGVAR VAR(&PROGRAM) VALUE(%SST(&DQDTA 1 10))
0017.00 CHGVAR VAR(&PGMLIB) VALUE(%SST(&DQDTA 11 10))
0018.00 CHGVAR VAR(&TR) VALUE(%SST(&dqdta 21 15))
0019.00 CALL PGM(&PGMLIB/&PROGRAM) PARM(&TR)
0020.00 ENDDO
0021.00 GOTO LOOP
0022.00
0023.00
0024.00 ENDPGM