Reports |
Overview
Automate Enterprise encompasses a comprehensive set of reporting tools that lets you gather and display vital information regarding all aspects of your automation environment. You can design a wide range of reports that deliver an assortment of statistics, such as execution analysis, historical performance, audit events, repository content details, trigger activities and much more. Reports can be easily printed or exported to a wide variety of client-viewing formats, including HTML, PDF, Excel, CSV and image formats.
All information generated into reports are stored in the Repository and conveniently centralized so administrators can easily monitor operations and quickly react to any issues that may occur. Reports are categorized into two distinct layouts; charts and tables. Reports can be accessed from the Server Management Console by selecting Reports from the Navigation bar.
Charts
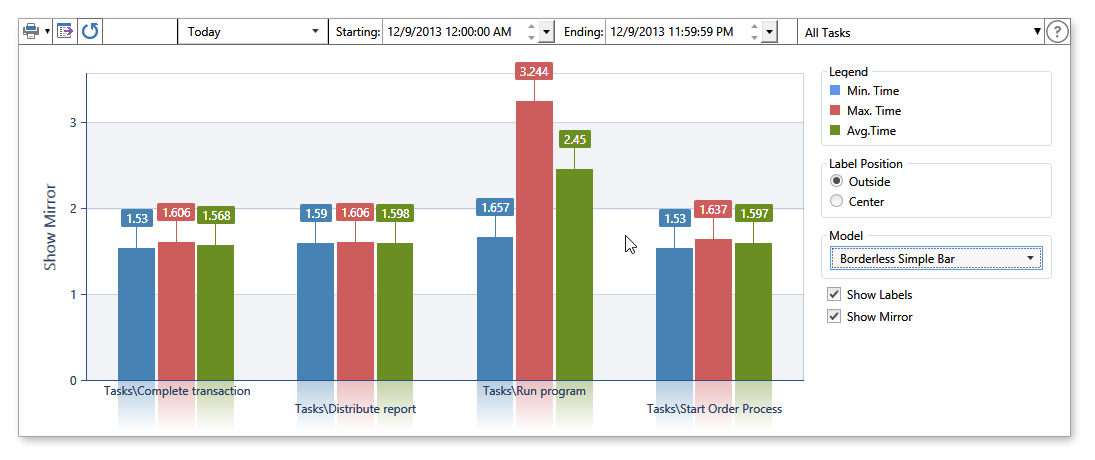
Charts display statistical and graphical information about Workflow and Task performance in an easy to understand and an easy to maintain manner (as shown below). A variety of bar charts are offered, each of which are designed to convey specific execution data. Details can be easily filtered to display runtime information of a single object, group of objects or all existing objects. Other filter parameters include statistic type (i.e. Success, Failure) and date/time.
You can generate charts to summarize data in a visual format and present large volumes of information at a glance so the viewer can come to an immediate understanding of the numbers. For instance, when a specific bar is twice as tall as the rest, it's easy to see who's doing the largest share of the work. Bar graphs can also be used for more complex comparisons of data with grouped bar charts and stacked bar charts.
Available Charts
The table below lists the available chart modules found in the SMC:
| Chart Name | Description |
|---|---|
| Task Durations Chart | Displays a graphical representation of previous task execution durations measured in seconds. Results include minimum, maximum and average execution times which are color coded for easy recognition. Horizontal bars represent the duration values for a task. Bar lengths are proportional to the values that they represent. |
| Task Results Chart | Supplies a numerical or percentage account of previous task execution results, which can be one of four values; Success, Failure, Stopped or Aborted. Each execution result is color coded for ease of identification. By default, this chart displays horizontal bars that represent the total number of occurrences of a specific execution result for a task. Bar lengths are proportional to the values that they represent. Alternatively, it can return percentage values which generates a single bar for each task with relevant execution results stacked (one above the other), each bar portion revealing result occurrences as percentage values. |
| Workflow Durations Chart | Displays a graphical representation of previous workflow execution durations measured in seconds. Results include minimum, maximum and average execution times which are color coded for easy recognition. Horizontal bars represent the duration values for a task. Bar lengths are proportional to the values that they represent. |
| Workflow Results Chart | Supplies a numerical or percentage account of previous workflow execution results, which can be one of four values; Success, Failure, Stopped or Aborted. Each execution result is color coded for easy identification. By default, the this chart displays horizontal bars that represent the total number of occurrences of a specific execution result for a workflow. Bar lengths are proportional to the values that they represent. Alternatively, this chart can return percentage values which generates a single bar for each workflow with relevant execution results stacked (one above the other), each bar portion revealing result occurrences as percentage values. |
Tables
Automate Enterprise contains a variety of table reports that provide statistics in regards to Agents, Repository content, Events/Conditions, execution events and audit events. This tool come with an extensive, in-built query engine that allows customization of reports based on the specified filter queries. You can filter records, so you only see those that interest you, then sort and group the remaining records any way you want. You can rearrange a table in a variety of ways, such as add columns, change sort orders, move columns around. Once you've created your report, you can easily export it to a number of formats (that is, PDF, XLS, CSV, RTF, etc.) and print or distribute it by way of email with a single click of a button.

Available Tables
Below lists the available table modules found in the SMC:
| Table Name | Description |
|---|---|
| Agents Table | Displays two separate table views that provide information in regards to existing agents and agent groups. The parent table provides basic information about an agent or group, such as name, type and status. Clicking the Details link opens a table that includes further details regarding dependencies for the specified agent or group. |
| Audit Events Table | Provides a table view of all the auditing events related to Automate Enterprise. Events include when a trigger, task or workflow was created, modified, deleted or renamed, when an agent was registered or unregistered, when a task or workflow was imported or exported and a number of other events. Users can categorize the report based on a variety of predefined date ranges or a custom date range, add or omit specific data types in which to include to the report, sort columns in descending or ascending order, use the Filter Editor to create custom filters and export tables to a variety of file formats. |
| Execution Events Table | Provides a table view of executed tasks and workflows. Users can categorize the report by the current day, previous day, last week or month, before or after a particular date/time, or a custom date range. Reports can be generated for a single object all objects or objects categorized into separate folders. Data can be sorted and grouped against an unlimited number of columns. A Filter Editor enables the creation of custom filters and reports can be exported to HTML, XML, XLS and TXT file formats, among others. |
| Repository Contents Table | Provides a table view of all repository items, including workflows, tasks, events and conditions in table format. Users can run the report for a single object, all objects or objects that are categorized into separate folders, add or omit specific columns in which to include to the report and use the Filter Editor to enable the creation of custom filters. |
| Users Table | Contains two separate table views that provide information in regards to existing users and user groups. The parent table displays information about a user or group. Clicking the See Users or See Groups link under the Dependencies column opens a new table that includes further details regarding dependencies for the specified user or group. |
| WorkFlow Triggers Table | Provides a table view of all the triggers (events or conditions) associated with each workflow. Users can run a report for a single workflow, all workflows or workflows that are categorized into separate folders, add or omit specific columns in which to include to the report, use the Filter Editor to enable the creation of custom filters and export the table to a variety of file formats. |