Breakpoints
Overview
When a task runs, execution time of each step may only amount to 1 or 2 seconds, making it difficult to examine certain steps that may not be running properly. Breakpoints may be the most ideal solution in this situation. They enable you to suspend task execution where and when you need to. Entering break mode does not stop or end the execution of your task. Elements, such as variables, datasets and functions remain in memory, but their movements and activities are suspended. During the interruption, you can view the Debug panel to acquire knowledge about your task and determine if it is functioning as expected.
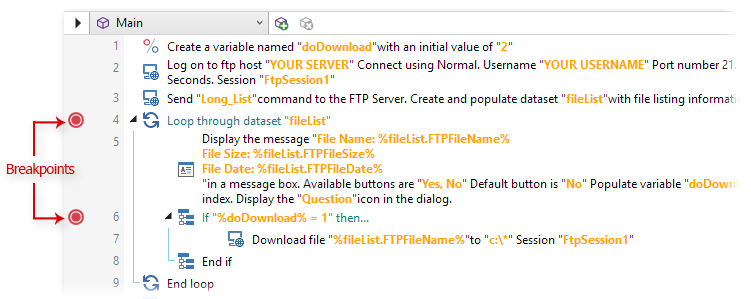
Breakpoints can be set at any step and can be used as many times as needed in a single task. They take effect only when a task is run from Task Builder and are ignored when the task is triggered or executed manually outside of Task Builder. Breakpoints are designated by a red, circled icon located on the left side of the step number in the Steps panel. The Breakpoints debug window can be used to examine and manage breakpoints within a given task. Using breakpoints can speed up the debugging process enormously. Without this feature, it would be very difficult to debug a large task.
General behavior
When a running task reaches a breakpoint step, Task Builder pauses execution, at which point, you can verify proper completion of a particular step or examine the data produced by the assortment of debugging windows located in the Debug panel. This is made possible because a paused task still remains in a running state but suspended between actions. Variables and datasets retain their values and the Output window continues to display detailed information about the task up to the suspended step. You can view step details generated by the Output window or view the Variables window to determine the current value of a certain variable or dataset. In addition, you can manage existing breakpoints or easily jump to a breakpoint step by way of the Breakpoints window.
Depending on what you determine from the data displayed, you can then click Continue from the ribbon to continue the task, click Step to continue the task step by step, or click Stop to halt task execution and reset all debugging elements.
To set a single breakpoint, do one of the following
- From within the Steps panel, click the gray margin to the left of the step number on the line where you want to set the breakpoint.
- Select (highlight) the step you want to place a breakpoint and on the Step tab of the ribbon, and then select the Breakpoint command from the Step command group.
To set multiple breakpoints simultaneously
- From the Steps panel, select the steps in which to place a breakpoint. To select more than one step, hold down CTRL during selection.
- From the Ribbon control, go to the Step tab, and then select Breakpoint from the Step command group.