Debug Panel
Overview
To ensure that newly created tasks are functioning properly before they are put into production, the Task Builder's Debug panel contains a variety of testing and debugging features that enables verbose, real time information to be displayed during task execution. This allows developers to easily monitor and examine many aspects of a task as it is being constructed. With the use of the Debug panel, developers can perform a series of “test runs” within the Task Builder and view a variety of debugging and diagnostic features such as output data, variable values, and breakpoints, to determine the cause of a problematic task.
The Debug panel contains ten debug views separated by tabs. Here, you can select the Variables tab to view variables and datasets that are contained in the task as well as their initial and current values, or select the Output tab to view step-by- step information about the task during execution. Right-click each debug view to select relevant options/commands for that particular view.
Debug Panel views
The available debug tools are listed below:
| Debug Panel View | Description |
|---|---|
| Debug Panel - Attachments | Lists all the files that are attached to the current task. |
| Debug Panel - Breakpoints | Lists all breakpoints contained in the task and their corresponding steps. |
| Debug Panel - Comments | Displays each comment in the task along with its step number. |
| Debug Panel - Labels | Lists all labels in the task, including the label name and corresponding step number. |
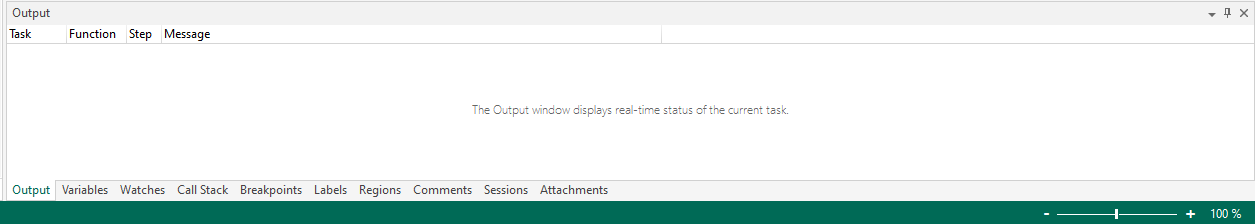
| Debug Panel - Output | Shows detailed step by step information about the task during execution. |
| Debug Panel - Regions | Displays the list of regions contained in the task, including region name and corresponding step number. |
| Debug Panel - Sessions | Displays a list of steps that contain sessions within the task. |
| Debug Panel - Call Stack | Displays the depth of the currently running task. When a sub-task is running, its immediate parent is listed below it. |
| Debug Panel - Variables | Lists variables and datasets that are contained in the task as well as their initial and current values. |
| Debug Panel - Watches | Shows all currently set watches and displays the evaluated values for the watched variables and expressions as the task runs. |