Active View - Web App Details
Overview
Web Application Scanning (WAS) Active View gives you a comprehensive, aggregate health assessment of your environment. It helps you identify your vulnerabilities and optimize remediation resources.
The Active View: Web App Details page is the central location for viewing details for a specific web application in your environment. It is used throughout WAS to display web app scan results and is filtered based on the web app you select.
WAS Web App Details page components
| Ref. | Description |
|---|---|
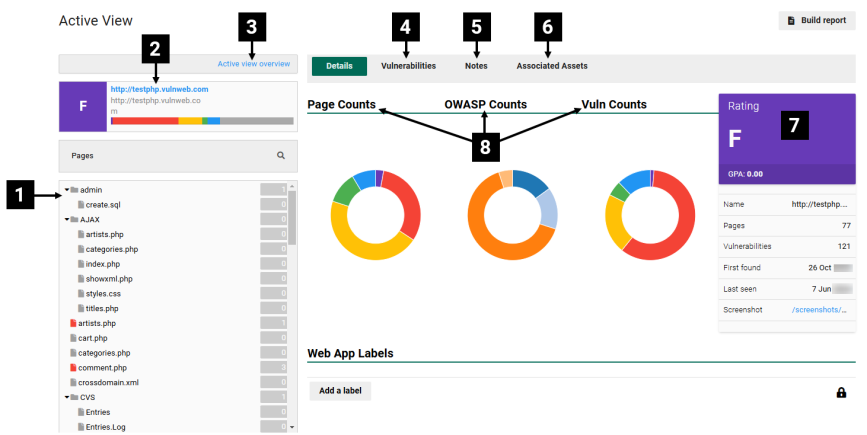
| 1 | The directory tree shows the number of vulnerabilities within each folder and file. Select a folder or file to reveal its specific vulnerabilities. Select the magnifying glass to search for specific files or folders. |
| 2 | Web application’s name, and a graph showing the severity levels of the web application’s vulnerabilities. TIP: Hover over the graph to see, for example, how many medium vulnerabilities a web app has. |
| 3 | Select to return to the Active View - Overview page, which also returns you to the web applications list and an aggregate health assessment of your environment. |
| 4 | This tab provides information about the web application’s vulnerabilities. See related: Active View - Vulnerabilities. |
| 5 | This tab lets you view and add notes about the web app. |
| 6 | This tab shows any related DNS Servers or hosts. Select a DNS name or host name to open the asset page in WAS. |
| 7 | Provides a summary of your scan, including its Security GPA. |
| 8 |
|