Database Faults History Dashboard Widget
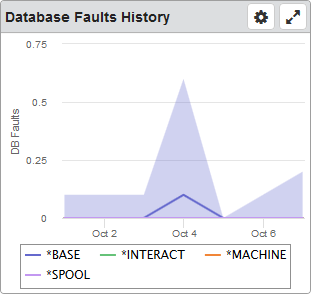
For the selected node, this widget displays the number of database faults that occurred over a period of time. These are faults against pages containing either database data or access paths. The rate is shown in page faults per second.
Things you can do:
ClickTap  Maximize to view the widget full-screen. ClickTap
  X to view it on the dashboard again.
If the data is in a graph:
-
Hover your mouse overTouch and hold the lines or bars to view information about the data.
Note: The lines in the graph show the average of the values, the shaded areas show the range.
-
ClickTap a data point to view a graph for that point in time. There are two things you can do on the new graph:
To view the Performance Details page, clicktap a data point.
To return to the previous graph, clicktap
 Back.
Back. -
ClickTap any item in the legend to hide or show its data in the graph.
-
ClickTouch and drag over an area of the graph to zoom in or out. ClickTap Reset Zoom to go back to the default.
If the data is in a table:
-
ClickTap a row to view the Performance Details page for that data.
To change the settings:
-
ClickTap
 Settings on the widget.
 -
Type a new Name, if necessary.
-
ClickTap Reset Name to have the software create a name based on the widget and the settings you've selected.
Note: If you change any of the settings on this page and you're using the system-generated widget name, be sure to click Reset Name before saving your changes.
-
Select the display Size of the widget on the dashboard. This affects the height of the widget.
-
ClickTap the Auto-Refresh button to enable it (Yes) or disable it (No).
-
Type the number of minutes to wait between each Auto-Refresh (Mins).
Note: If a dashboard is displayed and you step away from your screen, as long as the time you enter here is less than what the Robot Network for Insite administrator enters for the Session Timeout, your session will not time out.
-
Select Graph or Table for the data display.
-
Select the Data Range for the data.
-
ClickTap Look Up to select the system you want.
-
ClickTap Save.
Note: ClickTap Delete to delete this widget from the dashboard.