Performance Details
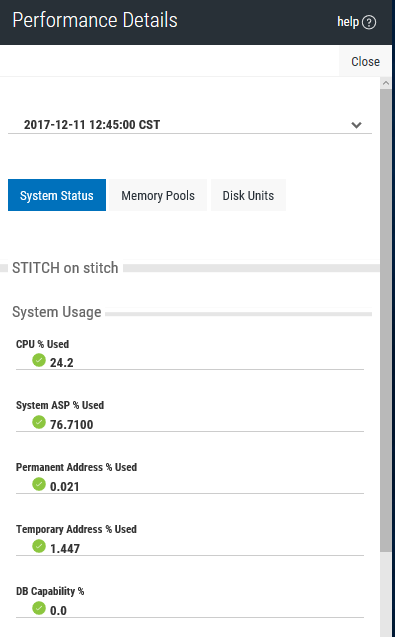
The Performance Details page shows detailed performance metrics for a single node. You can access the Performance Details page from a node on the My Network page. You can also access it if you clicktap the data points, bars, or rows in many of the widgets that you can add to your dashboards. When you access is from a data point, the value that brought you to the Performance Details is highlighted on the page.
Things you can do:
-
ClickTap Close to return to the My Network page or the dashboard.
-
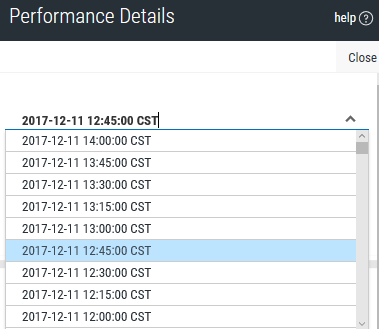
ClickTap the down arrow by the date and time to select a different collection interval.

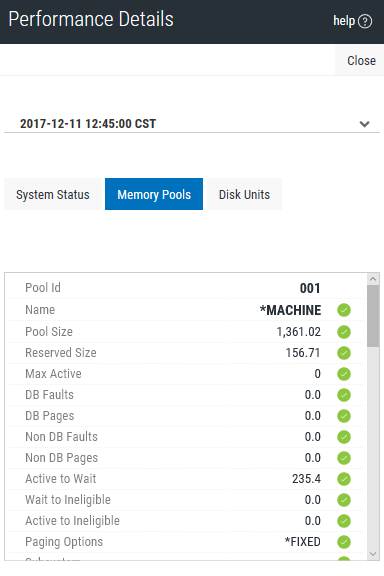
The Memory Pools tab displays a group of metrics that depicts the status of a node at a collected interval. Note: If you'd like to capture the metrics shown on this page for use outside of Robot Network, such as in an Microsoft Office Excel® file, simply copy the information in this table and paste it into the program you're using.

Column Descriptions:
-
Pool ID: The system-related pool identifier for each of the system storage pools that currently has main storage allocated to it.
-
Name: The name of this storage pool. The name may be a number, in which case it is a private pool associated with a subsystem.
-
Pool Size: The amount, in megabytes, of main storage in the pool.
-
Reserved Size: The amount, in megabytes, of storage in the pool that's reserved for system use (for example, for save/restore operations or for initiating secondary threads).
-
Max Active: The maximum number of threads that can use the processor concurrently.
-
DB Faults: The rate, in page faults per second, of database faults against pages containing either database data or access paths. Note: A page fault is a program notification that occurs when a page that's marked as not in main storage is referred to by an active program. An access path is the means by which the system provides a logical organization to the data in a database file.
-
DB Pages: The rate, in pages per second, at which database pages are brought into the storage pool. Note: A page is a 4096-byte block of information that is transferable between auxiliary storage and main storage.
-
Non DB Faults: The rate, in page faults per second, of non-database faults against pages other than those designated as database pages.
-
Non DB Pages: The rate, in pages per second, at which non-database pages are brought into the storage pool.
-
Active to Wait: The rate, in transitions per minute, of transitions of threads from an active condition to a waiting condition.
-
Wait to Ineligible: The rate, in transitions per minute, of transitions of threads from a waiting condition to an ineligible condition.
-
Active to Ineligible: The rate, in transitions per minute, of transitions of threads from an active condition to an ineligible condition.
-
Paging Options: The paging option associated with the pool. The paging option determines whether the system should dynamically adjust the paging characteristics of the storage pool for optimum performance. The following are the possible paging option values:
-
*FIXED: The system does not dynamically adjust the paging characteristics of the storage pool; it uses system-default values.
-
*CALC: The system dynamically adjusts the paging characteristics of the storage pool for optimum performance.
-
USRDFN: The system does not dynamically adjust the paging characteristics of the storage pool. It uses values that have been defined through an application programming interface (API).
-
-
Subsystem: The name of the subsystem that was specified on the STRSBS (Start Subsystem) command.
ClickTap Close to close the page.
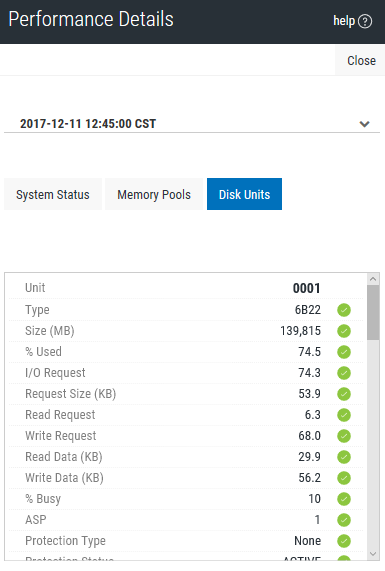
The Disk Units tab displays information about disk drives that the selected node is using. Note: If you'd like to capture the metrics shown on this page for use outside of Robot Network, such as in an Microsoft Office Excel® file, simply copy the information in this table and paste it into the program you're using.

Column Descriptions:
-
Unit: This is the same number used by the display disk configuration function of system service tools. If the disk unit identifier is 0, the disk unit is not configured.
-
Type: The type of disk unit. The size displayed for this unit may vary depending on the percentage of temporary space compared to the percentage of permanent space that resides on the disk.
-
Size (MB): The total amount of storage (in MB) that the unit can contain.
-
% Used: The percentage of the disk that is currently allocated. If the unit is an independent ASP which is currently in a varied off state, this field may be blank.
-
I/O Request: The average number of I/O requests for read and write operations that occurred per second during the elapsed time.
-
Request Size (KB): The average size of an I/O request in KB during the elapsed time.
-
Read Request: The average number of requests per second to transfer data from the disk unit during the elapsed time.
-
Write Request: The average number of requests per second to transfer data to the disk unit during the elapsed time.
-
Read Data (KB): The average amount of data, in KB, transferred from the disk unit, per request, during the elapsed time.
-
Write Data (KB): The average amount of data, in KB, transferred to the disk unit, per request, during the elapsed time.
-
% Busy: The estimated percentage of time the disk unit is being used during the elapsed time. This estimate is based on the number of I/O requests, the amount of data transferred, and the performance characteristics of the type of disk unit. This field is blank if the performance characteristics of the disk unit are not available.
-
ASP: The auxiliary storage pool identifier for the unit.
-
Protection Type: This field shows whether the unit is under mirrored protection provided by the system software, and the type of protection.
-
Protection Status: The protection status of the individual unit.
-
Compression: Shows whether or not the unit is compressed.
-
Average Response Time (ms): The average amount of time, measured in milliseconds, for the unit to respond to a request.
ClickTap Close to close the page.
