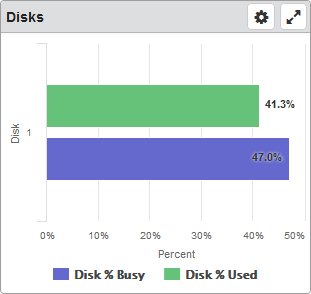
Disks Dashboard Widget
For the selected node, this widget displays the information from both the Disk Busy and Disk Used dashboard widgets in one place. So, you'll see the percentage of time the disk unit is being used during a period of time (Busy) and how fully allocated the disk was during that time (Used).
Things you can do:
ClickTap Maximize to view the widget full-screen. ClickTap
  X to view it on the dashboard again.
If the data is in a table or a graph:
ClickTap a row or bar to view the Performance Details page for the data.
To change the settings:
ClickTap
 Settings on the widget.
Type a new Name, if necessary.
ClickTap Reset Name to have the software create a name based on the widget and the settings you've selected.
Note: If you change any of the settings on this page and you're using the system-generated widget name, be sure to click Reset Name before saving your changes.
Select the display Size of the widget on the dashboard. This affects the height of the widget.
ClickTap the Auto-Refresh button to enable it (Yes) or disable it (No).
Type the number of minutes to wait between each Auto-Refresh (Mins).
Note: If a dashboard is displayed and you step away from your screen, as long as the time you enter here is less than what the Robot Network for Insite administrator enters for the Session Timeout, your session will not time out.
Select Graph or Table for the data display.
ClickTap Look Up to select the system you want.
ClickTap Save.
Note:ClickTap Delete to delete this widget from the dashboard.