Node Product Summary Dashboard Widget
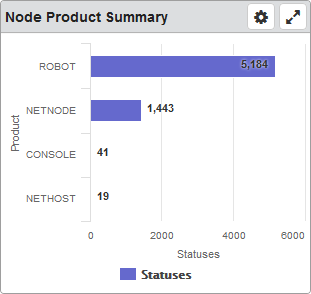
This widget shows the status counts for the Robot products and user applications on a single, selected system, sorted by the highest severity status. The levels from highest to lowest are: Attention, Warning, and Informational. To see this information for several systems at once, see the Robot Product Summary widget.
Things you can do:
ClickTap Maximize to view the widget full-screen. ClickTap
  X to view it on the dashboard again.
If the data is in a graph:
Hover your mouse overTouch and hold the bars to view information about the data.
ClickTap a bar to view the Status Center.
If the data is in a table:
ClickTap a row to view the Status Center.
To change the settings:
ClickTap
 Settings on the widget.
Type a new Name, if necessary.
ClickTap Reset Name to have the software create a name based on the widget and the settings you've selected.
Note: If you change any of the settings on this page and you're using the system-generated widget name, be sure to click Reset Name before saving your changes.
Select the display Size of the widget on the dashboard. This affects the height of the widget.
ClickTap the Auto-Refresh button to enable it (Yes) or disable it (No).
Type the number of minutes to wait between each Auto-Refresh (Mins).
Note: If a dashboard is displayed and you step away from your screen, as long as the time you enter here is less than what the Robot Network for Insite administrator enters for the Session Timeout, your session will not time out.
Select Graph or Table for the data display.
ClickTap Look Up to select the system you want.
ClickTap Save.
Note: ClickTap Delete to delete this widget from the dashboard.