Performance Summary Dashboard Widget
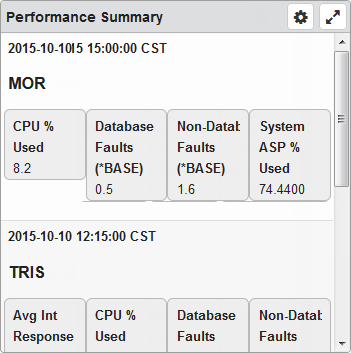
This widget displays a number of performance metrics for the selected systems. The systems are sorted from the one with the highest level of status issues to the lowest. Note: You can set the performance metric thresholds for the nodes using the Robot Network Explorer (the graphical user interface).
Things you can do:
ClickTap Maximize to view the widget full-screen. ClickTap
  X to view it on the dashboard again.
ClickTap any node to view the Performance Details page for it.
To change the settings:
ClickTap
 Settings on the widget.
Type a new Name, if necessary.
ClickTap Reset Name to have the software create a name based on the widget and the settings you've selected.
Note: If you change any of the settings on this page and you're using the system-generated widget name, be sure to click Reset Name before saving your changes.
Select the display Size of the widget on the dashboard. This affects the height of the widget.
ClickTap the Auto-Refresh button to enable it (Yes) or disable it (No).
Type the number of minutes between each Auto-Refresh (Min).
Note: If a dashboard is displayed and you step away from your screen, as long as the time you enter here is less than what the Robot Network for Insite administrator enters for the Session Timeout, your session will not time out.
Select the Metric you want to include. You can select more than one.
Select the Systems to display.
If you select Host, Node, or Node Group, clicktap Look Up to select the systems you want.
ClickTap Save.
Note:ClickTap Delete to delete this widget from the dashboard.